Don't miss this opportunity to own a well-positioned 2/2 duplex on each side in the desirable Golden Gate area of Naples! Located at 1803 40th Ter SW, this multifamily property offers approximately 2,076 square feet of living area, situated on an oversized 0.33-acre lot. Built in 2002, this property provides an excellent opportunity for investors seeking rental income, long-term appreciation, or owner occupancy with additional income potential.
For sale
$690,000
1803 40th TER SW, NAPLES, FL 34116
4beds
2,076sqft
Duplex
Built in 2002
-- sqft lot
$663,500 Zestimate®
$332/sqft
$-- HOA
What's special
- 9 hours
- 34
- 1
Zillow last checked:
Listing updated:
Listed by:
Andre Paz 239-227-3659,
Premiere Plus Realty Company
Source: SWFLMLS,MLS#: 226041835 Originating MLS: Naples
Facts & features
Interior
Bedrooms & bathrooms
- Bedrooms: 4
- Bathrooms: 4
- Full bathrooms: 4
Heating
- Central
Cooling
- Central Air
Features
- Flooring: Vinyl
- Has fireplace: No
Interior area
- Total interior livable area: 2,076 sqft
Property
Features
- Waterfront features: None
Lot
- Size: 0.32 Acres
- Features: Regular
Details
- Parcel number: 35882360001
- Zoning: 8
Construction
Type & style
- Home type: MultiFamily
- Property subtype: Duplex
Materials
- Block, Brick
- Foundation: Concrete Block
- Roof: Shingle
Condition
- New construction: No
- Year built: 2002
Utilities & green energy
- Water: Central
Community & HOA
Community
- Features: Non-Gated
- Subdivision: 40TH TERRACE BUILDING
HOA
- Amenities included: None
Location
- Region: Naples
Financial & listing details
- Price per square foot: $332/sqft
- Tax assessed value: $399,140
- Annual tax amount: $4,958
- Date on market: 11/20/2026
- Lease term: Buyer Finance/Cash,CASH ONLY,FHA
Estimated market value
$663,500
$630,000 - $697,000
$2,715/mo
Price history
| Date | Event | Price |
|---|---|---|
| 11/20/2026 | Listed for sale | $690,000+160.4%$332/sqft |
Source:  SWFLMLS #226041835 Report a problem | ||
| 6/19/2003 | Sold | $265,000+703%$128/sqft |
Source: Public Record Report a problem | ||
| 2/21/2001 | Sold | $33,000+127.6%$16/sqft |
Source: Public Record Report a problem | ||
| 1/4/2000 | Sold | $14,500$7/sqft |
Source: Public Record Report a problem | ||
Public tax history
| Year | Property taxes | Tax assessment |
|---|---|---|
| 2025 | $4,958 -1.7% | $388,715 +10% |
| 2024 | $5,043 +11.5% | $353,377 +10% |
| 2023 | $4,522 +8.5% | $321,252 +10% |
| 2022 | $4,168 +5.8% | $292,047 +10% |
| 2021 | $3,939 +12.1% | $265,497 +10% |
| 2020 | $3,515 +17.8% | $241,361 +10% |
| 2019 | $2,984 +7.9% | $219,419 +10% |
| 2018 | $2,766 -13.4% | $199,472 +10% |
| 2017 | $3,193 +9.7% | $181,338 +10% |
| 2016 | $2,910 +6.1% | $164,853 +10% |
| 2015 | $2,742 +9.4% | $149,866 +10% |
| 2014 | $2,506 +57.2% | $136,242 +10% |
| 2013 | $1,594 +9.5% | $123,856 +10% |
| 2012 | $1,455 +9.1% | $112,596 +8.7% |
| 2011 | $1,333 -37.4% | $103,600 -6.7% |
| 2010 | $2,131 -43.3% | $111,093 -35.2% |
| 2009 | $3,757 | $171,318 -48.2% |
| 2008 | $3,757 -2% | $330,960 -6.9% |
| 2007 | $3,833 +17.4% | $355,524 +18% |
| 2006 | $3,266 | $301,303 +24.7% |
| 2005 | $3,266 +21.6% | $241,556 +23% |
| 2004 | $2,686 +2.1% | $196,438 +4.7% |
| 2003 | $2,631 +510.5% | $187,540 +520.2% |
| 2002 | $431 -19.2% | $30,240 +66.7% |
| 2001 | $533 +136.4% | $18,144 |
| 2000 | $226 | -- |
Find assessor info on the county website
Monthly payment
Est. payment
Payment breakdown
Explore the cost of this home by adjusting the details. Changes won't be saved.Climate risks
Neighborhood: Golden Gate

Similar homes
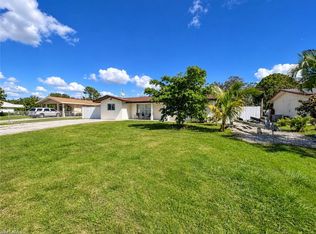
- $568,0004 bd2 ba2.1k sqft1924 41st ST SW, NAPLES, FL 34116For Sale
 MLS ID #226041931, Yaidel Hernandez Mendoza, A Plus Realty. SWFLMLS
- $649,0004 bd4 ba1.7k sqft4319 Golden Gate PKWY, NAPLES, FL 34116For Sale
 MLS ID #226039843, Wally Perez, Xclusive Homes LLC. SWFLMLS
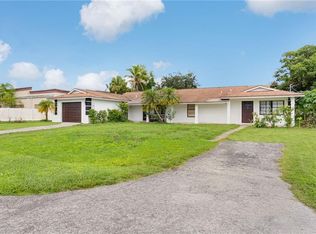
- $699,9004 bd4 ba1.8k sqft5067 27th PL SW, NAPLES, FL 34116For Sale
 MLS ID #226034532, Jean Paul, The Real Estate Connection LLC. SWFLMLS
- $720,0004 bd3 ba2.2k sqft3144 54th ST SW, NAPLES, FL 34116For Sale
 MLS ID #226041401, Georgia Pinto, Local Real Estate LLC. SWFLMLS
- $749,9006 bd6 ba2.4k sqft2001 46th TER SW, NAPLES, FL 34116For SaleMLS ID #226039951, Josh Yelensky, Current Property Management. SWFLMLS
- $665,0004 bd4 ba1.5k sqft4442 18th AVE SW, NAPLES, FL 34116For SaleMLS ID #226037311, Magdevys Rodriguez, PA, Coldwell Banker Realty. SWFLMLS
- $547,6103 bd2 ba1.2k sqft2233 45th ST SW, NAPLES, FL 34116For SaleMLS ID #226040368, Madeline Kearns, Sellstate Prime Realty. SWFLMLS
- $700,0004 bd3 ba1.7k sqft5253 32nd AVE SW, NAPLES, FL 34116For SaleMLS ID #226035196, Lisandra Figueroa Batista, Key & Legacy Realty LLC. SWFLMLS
- $699,0004 bd2 ba2.3k sqft6200 Sea Grass LN, NAPLES, FL 34116For SaleMLS ID #226033686, Gabriella Lagrasta, The Gebelhoff Group Of CO.. SWFLMLS
- $699,0004 bd3 ba2.7k sqft4109 29th PL SW, NAPLES, FL 34116For SaleMLS ID #226029825, Magdevys Rodriguez, PA, Coldwell Banker Realty. SWFLMLS
- $650,0004 bd4 ba1.8k sqft2154 50th TER SW, NAPLES, FL 34116For SaleMLS ID #226031094, Radiel Gutierrez, Realty One Group MVP. SWFLMLS
- $649,9995 bd4 ba2.1k sqft4587 25th CT SW, NAPLES, FL 34116For SaleMLS ID #226018581, Nathalia Mato, Mato Realty, LLC. SWFLMLS
- $890,0004 bd3 ba2k sqft2020 16th AVE SW, NAPLES, FL 34117For SaleMLS ID #226042049, Beatrice Astudillo, Premiere Plus Realty Company. SWFLMLS
- $900,0003 bd2 ba2.2k sqft2029 23rd St SW, Naples, FL 34117For Sale
 MLS ID #2026048707, Jody Siegel, Redfin Corporation. Florida Gulf Coast MLS
- $699,9003 bd2 ba1.8k sqft4525 29th AVE SW, NAPLES, FL 34116For SaleMLS ID #226023044, Javier Canizares, Xclusive Homes LLC. SWFLMLS
- $720,0004 bd3 ba2.7k sqft4238 32nd AVE SW, NAPLES, FL 34116For SaleMLS ID #226033846, DAMIANA Hernandez, A Plus Realty. SWFLMLS
- $439,9003 bd2 ba1.4k sqft2019 43rd Ln SW, Naples, FL 34116For SaleMLS ID #2026048170, Laura Rodriguez Leyva, Marzucco Real Estate. Florida Gulf Coast MLS
- $649,0003 bd2 ba1.9k sqft2025 49th TER SW, NAPLES, FL 34116For SaleMLS ID #226021113, Monica Vecino De La Torre, Premiere Plus Realty Co.. SWFLMLS
- $549,0004 bd3 ba1.8k sqft1701 54th TER SW, NAPLES, FL 34116For SaleMLS ID #226032761, Maria Estrella, John R Wood Properties. SWFLMLS
