Great investment Opportunity, building in a uphill are, each apartment has 2 bedrooms kitchen, living room and dining room, a brick 2 car garage, the property is sold as is conditions, the basement is in good size, is going to be easy to do another apartment and make it a 3 legal Building.
Active
$420,000
1851 N Lowell Ave, Chicago, IL 60639
4beds
--sqft
Multi Family
Built in 1924
-- sqft lot
$422,500 Zestimate®
$--/sqft
$-- HOA
What's special
Dining room
- 28 days
- 516
- 23
Likely to sell faster than
Zillow last checked:
Listing updated:
Listed by:
Salome Garcia 773-419-6784,
Internet Real Estate, LTD.
Source: MRED as distributed by MLS GRID,MLS#: 12788933
Facts & features
Interior
Bedrooms & bathrooms
- Bedrooms: 4
- Bathrooms: 2
- Full bathrooms: 2
Heating
- Has Heating (Unspecified Type)
Features
- Basement: Unfinished,Full
Property
Parking
- Total spaces: 2.5
- Parking features: Yes, Detached, Garage
- Garage spaces: 2.5
Lot
- Size: 3,125 Square Feet
- Dimensions: 25x125
Details
- Parcel number: 13344090020000
- Special conditions: None
Construction
Type & style
- Home type: MultiFamily
- Property subtype: Multi Family
Materials
- Brick
Condition
- New construction: No
- Year built: 1924
Utilities & green energy
- Sewer: Public Sewer
- Water: Public
Community & HOA
Location
- Region: Chicago
Financial & listing details
- Tax assessed value: $390,000
- Annual tax amount: $6,776
- Date on market: 10/19/2026
- Ownership: Fee Simple
Estimated market value
$422,500
$401,000 - $444,000
$1,922/mo
Price history
| Date | Event | Price |
|---|---|---|
| 10/19/2026 | Listed for sale | $420,000+300% |
Source:  MRED as distributed by MLS GRID #12788933 Report a problem | ||
| 8/9/1994 | Sold | $105,000 |
Source: Public Record Report a problem | ||
Public tax history
| Year | Property taxes | Tax assessment |
|---|---|---|
| 2024 | $7,862 +16% | $39,000 +21.9% |
| 2023 | $6,776 +2.6% | $32,003 |
| 2022 | $6,605 +2.3% | $32,003 |
| 2021 | $6,457 +26% | $32,003 +39.6% |
| 2020 | $5,125 -4.6% | $22,924 -14% |
| 2019 | $5,375 +2.1% | $26,656 |
| 2018 | $5,265 +15% | $26,656 -4.9% |
| 2017 | $4,580 -20.5% | $28,028 -10.3% |
| 2016 | $5,759 +9.8% | $31,249 |
| 2015 | $5,246 +16% | $31,249 +16% |
| 2014 | $4,524 -15.6% | $26,950 -16% |
| 2013 | $5,357 +0.9% | $32,083 |
| 2012 | $5,309 +12.7% | $32,083 -3.1% |
| 2011 | $4,713 +2.4% | $33,121 |
| 2010 | $4,601 +8.5% | $33,121 |
| 2009 | $4,239 -0.1% | $33,121 -8.8% |
| 2008 | $4,244 +10% | $36,303 |
| 2007 | $3,857 -26% | $36,303 |
| 2006 | $5,212 +30% | $36,303 +47.9% |
| 2005 | $4,010 +1% | $24,541 |
| 2004 | $3,970 +2.2% | $24,541 |
| 2003 | $3,883 +39.5% | $24,541 +58.4% |
| 2002 | $2,784 +3.8% | $15,493 |
| 2001 | $2,683 +4.5% | $15,493 |
| 2000 | $2,567 -0.7% | $15,493 +16% |
| 1999 | $2,584 | $13,360 |
Find assessor info on the county website
Monthly payment
Est. payment
Payment breakdown
Explore the cost of this home by adjusting the details. Changes won't be saved.Climate risks
Neighborhood: Hermosa
Nearby schools
Schools provided by the listing agent
- District: 299
Source: MRED as distributed by MLS GRID. This data may not be complete. We recommend contacting the local school district to confirm school assignments for this home.
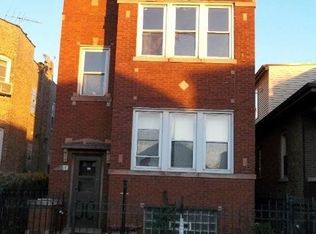
Similar homes
- $410,0005 bd3 ba3.4k sqft2243 N Kedvale Ave, Chicago, IL 60639Active
 MLS ID #12767041, Jose L Aparicio, New Hope Realty Group, Inc.. MRED as distributed by MLS GRID
- $425,0005 bd3 ba-- sqft4602 N Karlov Ave, Chicago, IL 60630New
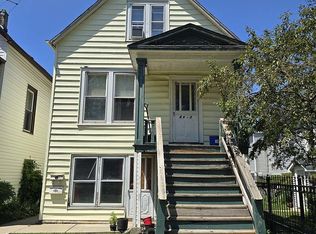 MLS ID #12807674, Kate Sanderson, HomeSmart Realty Group. MRED as distributed by MLS GRID
- $459,0004 bd2 ba-- sqft1711 N Austin Ave, Chicago, IL 60639Active
 MLS ID #12699537, Bill Eliopoulos, Cosmos Realty Investors, Inc.. MRED as distributed by MLS GRID
- $499,0004 bd3 ba-- sqft2426 N Lotus Ave, Chicago, IL 60639Active
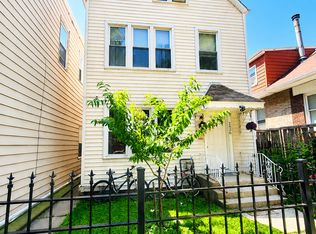 MLS ID #12724671, Monica Morales, Extreme Realty LLC. MRED as distributed by MLS GRID
