Great investment property with tons of potential . 3 bedrooms in each unit in a desired are of Chelsea. cheapest 3 family great investment property for rentals or owner occupy. it will not last ! private showings only!
For sale
$875,000
188 Clark Ave, Chelsea, MA 02150
6beds
2,664sqft
3 Family
Built in 1900
-- sqft lot
$858,200 Zestimate®
$328/sqft
$-- HOA
What's special
- 37 days
- 229
- 4
Zillow last checked:
Listing updated:
Listed by:
Arquimides Chinchilla 617-970-6278,
Perlera Real Estate 617-418-5280
Source: MLS PIN,MLS#: 73590824
Facts & features
Interior
Bedrooms & bathrooms
- Bedrooms: 6
- Bathrooms: 3
- Full bathrooms: 3
Features
- Flooring: Wood
- Has basement: No
- Has fireplace: No
Interior area
- Total structure area: 2,664
- Total interior livable area: 2,664 sqft
- Finished area above ground: 2,664
Property
Parking
- Parking features: Paved Drive
- Has uncovered spaces: Yes
Features
- Patio & porch: Porch
Lot
- Size: 2,792 Square Feet
Details
- Parcel number: M:0067 B:0000 L:0039,1289448
- Zoning: R2
Construction
Type & style
- Home type: MultiFamily
- Property subtype: 3 Family
Materials
- Foundation: Concrete Perimeter
Condition
- Year built: 1900
Utilities & green energy
- Sewer: Public Sewer
- Water: Public
Community & HOA
Location
- Region: Chelsea
Financial & listing details
- Price per square foot: $328/sqft
- Tax assessed value: $819,100
- Annual tax amount: $9,403
- Date on market: 10/14/2026
- Total actual rent: 6000
Estimated market value
$858,200
$815,000 - $901,000
$3,280/mo
Price history
| Date | Event | Price |
|---|---|---|
| 10/14/2026 | Listed for sale | $875,000+635.3%$328/sqft |
Source: MLS PIN #73590824 Report a problem | ||
| 12/20/1996 | Sold | $119,000+138%$45/sqft |
Source: Public Record Report a problem | ||
| 11/27/1995 | Sold | $50,000$19/sqft |
Source: Public Record Report a problem | ||
Public tax history
| Year | Property taxes | Tax assessment |
|---|---|---|
| 2025 | $8,696 -3.3% | $755,500 |
| 2024 | $8,990 +4.3% | $755,500 +8.5% |
| 2023 | $8,620 -1.6% | $696,300 +5.3% |
| 2022 | $8,760 +3.6% | $661,100 +6.5% |
| 2021 | $8,457 +31.4% | $620,900 +19.5% |
| 2020 | $6,434 -6% | $519,600 +8.2% |
| 2019 | $6,844 +13.5% | $480,300 +12.3% |
| 2018 | $6,032 +35.7% | $427,800 +6.3% |
| 2017 | $4,444 -8.5% | $402,600 +18.2% |
| 2016 | $4,855 +16.1% | $340,700 +17.3% |
| 2015 | $4,182 +20.8% | $290,400 +18.5% |
| 2013 | $3,463 +2.5% | $245,100 +0.2% |
| 2012 | $3,379 +3.5% | $244,700 -3.1% |
| 2011 | $3,264 +6.9% | $252,600 |
| 2010 | $3,054 -18.8% | $252,600 -27.5% |
| 2009 | $3,761 -14.8% | $348,200 -21.5% |
| 2008 | $4,415 +6.6% | $443,700 |
| 2007 | $4,140 +9.7% | $443,700 +13.1% |
| 2006 | $3,773 +8.2% | $392,200 +7.3% |
| 2005 | $3,487 +9.3% | $365,500 +6.3% |
| 2004 | $3,191 +27.5% | $343,900 +38% |
| 2003 | $2,502 +1.3% | $249,200 +46.5% |
| 2002 | $2,470 +34.9% | $170,100 +36.1% |
| 2000 | $1,831 | $125,000 |
Find assessor info on the county website
Monthly payment
Est. payment
Payment breakdown
Explore the cost of this home by adjusting the details. Changes won't be saved.Climate risks
Neighborhood: 02150


Similar homes
- $865,0006 bd3 ba2.4k sqft39 Spencer Ave, Chelsea, MA 02150For Sale
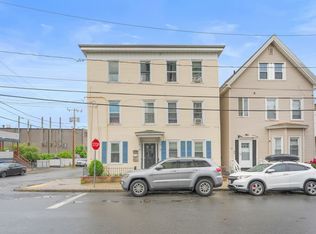 MLS ID #73541138, Ella Goren, Sunrise Realty & Investment LLC. MLS PIN
- $739,0006 bd2 ba2.5k sqft91 Tudor St, Chelsea, MA 02150For Sale
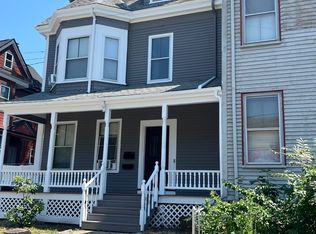 MLS ID #73599856, Debbie Lochiatto, Key Real Estate. MLS PIN
- $959,0006 bd2 ba2.9k sqft52 Sagamore St, Revere, MA 02151For Sale
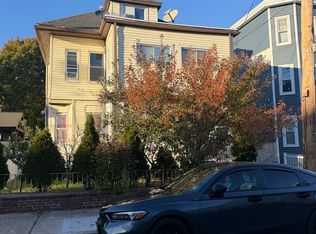 MLS ID #73594453, Rosemary Galindo, United Brokers. MLS PIN
- $999,9997 bd4 ba3.4k sqft75 Harvard St, Chelsea, MA 02150For Sale
 MLS ID #73570977, Pricila Ray, Keller Williams Realty. MLS PIN
