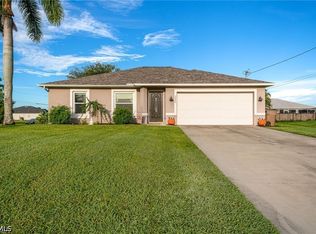
1908 S Gator Cir, is located in Cape Coral, FL 33909. It is currently listed for $64900. For more information, contact us at expert@hudlisted.com or call our Distressed Property Hot-line at (888) 576-0062.<br /> <br /> 1908 S Gator Cir is a single family home and was built in . It has 3 bedrooms and 2 baths. 1908 S Gator Cir was listed on .
Pre-foreclosure
Est. $274,200
1908 S Gator Cir, Cape Coral, FL 33909
3beds
2baths
1,632sqft
SingleFamily
Built in 1970
10,018 Square Feet Lot
$274,200 Zestimate®
$168/sqft
$-- HOA
Overview
- 156 days
- 10
- 0
Facts & features
Interior
Bedrooms & bathrooms
- Bedrooms: 3
- Bathrooms: 2
Heating
- Forced air
Cooling
- Central
Features
- Flooring: Carpet
Interior area
- Total interior livable area: 1,632 sqft
Property
Parking
- Parking features: Garage - Attached
Features
- Exterior features: Stucco
Lot
- Size: 10,018 Square Feet
Details
- Parcel number: 204324C1056400390
Construction
Type & style
- Home type: SingleFamily
Materials
- Roof: Asphalt
Condition
- Year built: 1970
Community & HOA
Location
- Region: Cape Coral
Financial & listing details
- Price per square foot: $168/sqft
- Tax assessed value: $232,781
- Annual tax amount: $4,631
Foreclosure details
Estimated market value
$274,200
$255,000 - $293,000
$1,911/mo
Price history
| Date | Event | Price |
|---|---|---|
| 11/4/2021 | Sold | $280,000$172/sqft |
Source:  Florida Gulf Coast MLS #221040469 Report a problem | ||
| 9/19/2021 | Pending sale | $280,000$172/sqft |
Source:  Florida Gulf Coast MLS #221040469 Report a problem | ||
| 9/17/2021 | Price change | $280,000-11.1%$172/sqft |
Source: Florida Gulf Coast MLS #221040469 Report a problem | ||
| 8/13/2021 | Pending sale | $315,000$193/sqft |
Source: Florida Gulf Coast MLS #221040469 Report a problem | ||
| 7/14/2021 | Price change | $315,000-3.1%$193/sqft |
Source: Florida Gulf Coast MLS #221040469 Report a problem | ||
| 6/27/2021 | Price change | $325,000-7.1%$199/sqft |
Source: Florida Gulf Coast MLS #221040469 Report a problem | ||
| 5/31/2021 | Listed for sale | $350,000+439.3%$214/sqft |
Source: Florida Gulf Coast MLS #221040469 Report a problem | ||
| 3/1/2011 | Sold | $64,900$40/sqft |
Source: Public Record Report a problem | ||
| 12/20/2010 | Pending sale | $64,900$40/sqft |
Source: Fannie Mae #201043359 Report a problem | ||
| 12/12/2010 | Price change | $64,900$40/sqft |
Source: Fannie Mae #201043359 Report a problem | ||
| 12/4/2010 | Listed for sale | -- |
Source: foreclosure.com Report a problem | ||
| 10/16/2010 | Listing removed | -- |
Source: foreclosure.com Report a problem | ||
| 10/8/2010 | Price change | -- |
Source: foreclosure.com Report a problem | ||
| 9/24/2010 | Price change | $64,900+29.5%$40/sqft |
Source: Fannie Mae Report a problem | ||
| 9/18/2010 | Listed for sale | -- |
Source: foreclosure.com Report a problem | ||
| 9/10/2010 | Sold | $50,100-78.1%$31/sqft |
Source: Public Record Report a problem | ||
| 1/9/2007 | Sold | $229,000+190.6%$140/sqft |
Source: Public Record Report a problem | ||
| 7/28/2005 | Sold | $78,800+203.1%$48/sqft |
Source: Public Record Report a problem | ||
| 7/15/2004 | Sold | $26,000+664.7%$16/sqft |
Source: Public Record Report a problem | ||
| 11/14/2002 | Sold | $3,400$2/sqft |
Source: Public Record Report a problem | ||
Public tax history
| Year | Property taxes | Tax assessment |
|---|---|---|
| 2025 | $4,631 -6% | $232,781 -10.3% |
| 2024 | $4,927 +6.4% | $259,607 +7.6% |
| 2023 | $4,633 +1.7% | $241,356 -1.9% |
| 2022 | $4,555 +199.7% | $246,142 |
| 2021 | $1,520 +0.8% | -- |
| 2020 | $1,508 +53.8% | $93,547 -38.4% |
| 2019 | $981 | $151,807 +69.2% |
| 2018 | $981 +1.1% | $89,739 +2.1% |
| 2017 | $970 +0.6% | $87,893 -32.4% |
| 2016 | $965 +4.2% | $130,094 +14.5% |
| 2015 | $926 +2.5% | $113,590 +11.2% |
| 2014 | $903 +18.9% | $102,110 +20.7% |
| 2013 | $760 +18.6% | $84,598 +13.2% |
| 2012 | $640 -61.9% | $74,710 +10% |
| 2011 | $1,679 +6.6% | $67,893 +10.5% |
| 2010 | $1,575 -18.2% | $61,420 -21.9% |
| 2009 | $1,924 -9.7% | $78,660 -46.8% |
| 2008 | $2,130 -30.8% | $147,850 -20.7% |
| 2007 | $3,076 +125.2% | $186,520 +159.4% |
| 2006 | $1,366 +346.9% | $71,900 +479.8% |
| 2004 | $306 +152.6% | $12,400 +222.9% |
| 2003 | $121 +64.8% | $3,840 +113.3% |
| 2002 | $73 | $1,800 +44% |
| 2000 | -- | $1,250 |
Find assessor info on the county website
Monthly payment
Climate risks
Neighborhood: 33909

Similar homes
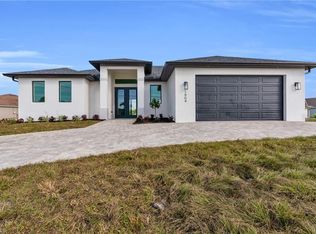
- $299,9003 bd2 ba1.7k sqft3449 NE 11th Ave, Cape Coral, FL 33909For Sale
 MLS ID #2026042912, A.D. Diaz, Century 21 Sunbelt Realty. Florida Gulf Coast MLS
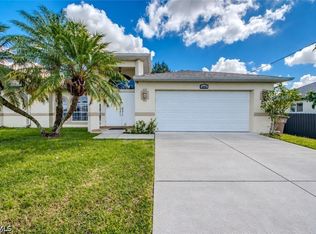
- $299,9994 bd2 ba1.4k sqft1501 NE 33rd ST, CAPE CORAL, FL 33909For Sale
 MLS ID #226038032, Trevor Caldwell, Local Real Estate LLC. SWFLMLS
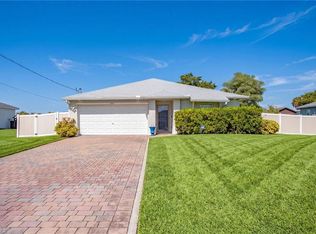
- $289,0003 bd2 ba1.2k sqft1615 NE 34th Lane Cpe, Coral, FL 33909For Sale
 MLS ID #2026038538, Javier Diaz, MAXREV LLC. Florida Gulf Coast MLS
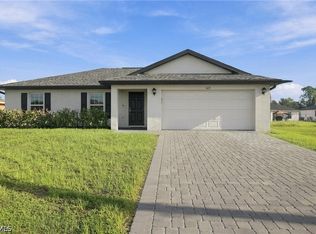
- $269,9003 bd2 ba1.2k sqft3630 NE 11th Pl, Cape Coral, FL 33909For Sale
 MLS ID #2026040135, Jimi Walton, Schooner Bay Realty, Inc.. Florida Gulf Coast MLS
- $309,0004 bd2 ba1.8k sqft3516 NE 19th AVE, CAPE CORAL, FL 33909For SaleMLS ID #226036478, Rob Meissner, LLC, Palm Paradise Realty Group.LLC. SWFLMLS
- $289,8884 bd2 ba1.4k sqft1607 NE 35th LN, CAPE CORAL, FL 33909For SaleMLS ID #226017037, Armid Metohu, Coldwell Banker Realty. SWFLMLS
- $292,0003 bd2 ba1.5k sqft3570 NE 11th Ave, Cape Coral, FL 33909For SaleMLS ID #2026032984, Nancy Berg, Coldwell Banker Realty. Florida Gulf Coast MLS
- $290,0003 bd2 ba1.5k sqft3714 NE 17th Ave, Cape Coral, FL 33909For SaleMLS ID #2026026476, Deb LaSala Lenard, Rossman Realty Group Inc. Florida Gulf Coast MLS
- $294,6943 bd2 ba1.5k sqft1610 NE 34th ST, CAPE CORAL, FL 33909For SaleMLS ID #226033957, Kimberlee McClellan, Ai Brokers, LLC. SWFLMLS
- $315,9003 bd2 ba1.6k sqft1622 NE 33rd Ter, Cape Coral, FL 33909For SaleMLS ID #2026033343, Jim Grimm, Pelican's Nest Realty Services. Florida Gulf Coast MLS
- $312,9903 bd2 ba1.4k sqft2314 NE 36th ST, CAPE CORAL, FL 33909New ConstructionSWFLMLS
- $300,0003 bd2 ba1.6k sqft2536 Laurentina Ln, Cape Coral, FL 33909For SaleMLS ID #2026033090, Dorothy Izzo, John R. Wood Properties. Florida Gulf Coast MLS
- $325,0003 bd2 ba1.3k sqft1635 NE 33rd St, Cape Coral, FL 33909For SaleMLS ID #2026039294, Dirk Blume, Keller Williams Elite Realty. Florida Gulf Coast MLS
- $299,9003 bd2 ba1.6k sqft3606 NE 13th AVE, CAPE CORAL, FL 33909For SaleMLS ID #226030497, Amanda Barcenas, Realty One Group MVP. SWFLMLS
- $259,5004 bd2 ba1.4k sqft1108 NE 36th Ln, Cape Coral, FL 33909For SaleMLS ID #2026034142, Nicole Pistone, Cornerstone Coastal Properties. Florida Gulf Coast MLS
- $275,0003 bd2 ba1.4k sqft4108 Garden Blvd, Cape Coral, FL 33909For SaleMLS ID #2026016938, Joe Petno, EXP Realty LLC. Florida Gulf Coast MLS
- $284,9903 bd2 ba1.4k sqft2117 NE 33rd St, Cape Coral, FL 33909New ConstructionMLS ID #2026030223, Chris Morimanno, Coaston Realty LLC. Florida Gulf Coast MLS
- $314,9003 bd2 ba1.6k sqft3500 Dandolo Cir, Cape Coral, FL 33909For SaleMLS ID #2026038508, Mary Jo Bianchini, Arterra Luxe-Florida LLC. Florida Gulf Coast MLS
- $300,0004 bd3 ba2k sqft2571 Laurentina Ln, Cape Coral, FL 33909For SaleMLS ID #2026041255, John Paul Perkins, North Port Realty LLC. Florida Gulf Coast MLS
- $309,9003 bd2 ba1.9k sqft3602 NE 12th Ct, Cape Coral, FL 33909For SaleMLS ID #2026008747, Andy Gonzalez, M&M Realty Solutions LLC. Florida Gulf Coast MLS
