$313,000
5 bd|3 ba|1.9k sqft
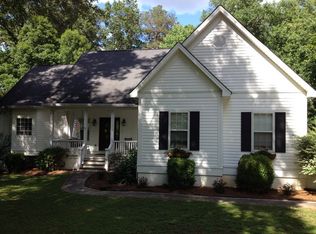
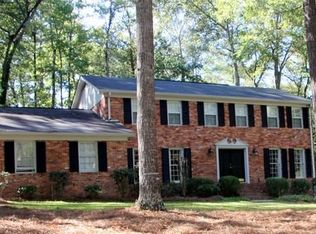
188 Arlington Row, Macon, GA 31210
Off Market
Likely to sell faster than
Zillow last checked:
Listing updated:
Megan Harman,
EXP REALTY ASSOCIATES
Not available
Estimated sales range
Not available
$2,458/mo
| Date | Event | Price |
|---|---|---|
| 5/30/2026 | Price change | $85,500-3.4% |
Source: CGMLS #262559 Report a problem | ||
| 4/28/2026 | Listed for sale | $88,500+4.1% |
Source: CGMLS #262559 Report a problem | ||
| 10/1/2024 | Listing removed | $85,000 |
Source: | ||
| 9/21/2023 | Listed for sale | $85,000 |
Source: | ||
| 7/1/2023 | Listing removed | $85,000 |
Source: | ||
| 12/18/2022 | Listing removed | -- |
Source: | ||
| 12/17/2022 | Listed for sale | $85,000+41.7% |
Source: | ||
| 6/24/2022 | Sold | $60,000 |
Source: | ||
| 6/16/2022 | Pending sale | $60,000 |
Source: | ||
| 6/5/2022 | Listed for sale | $60,000 |
Source: | ||
| 6/2/2022 | Listing removed | -- |
Source: | ||
| 5/17/2022 | Price change | $60,000-7.7% |
Source: | ||
| 4/26/2022 | Listed for sale | $65,000 |
Source: | ||
| 4/4/2022 | Pending sale | $65,000 |
Source: | ||
| 3/4/2022 | Price change | $65,000-13.3% |
Source: | ||
| 2/14/2022 | Listed for sale | $75,000-21.1% |
Source: | ||
| 6/28/2019 | Sold | $95,000-17.4% |
Source: | ||
| 6/24/2019 | Pending sale | $115,000 |
Source: Fickling & Company, Inc. #150656 Report a problem | ||
| 6/21/2019 | Listed for sale | $115,000 |
Source: Fickling & Company, Inc. #150656 Report a problem | ||
| 5/31/2019 | Pending sale | $115,000 |
Source: Fickling & Company, Inc. #150656 Report a problem | ||
| 5/28/2019 | Listed for sale | $115,000 |
Source: Fickling & Company, Inc. #150656 Report a problem | ||
| Year | Property taxes | Tax assessment |
|---|---|---|
| 2025 | $489 -1.3% | $20,160 |
| 2024 | $495 -18.7% | $20,160 -40.4% |
| 2023 | $610 -80.1% | $33,850 -61.7% |
| 2022 | $3,061 +0.1% | $88,401 +9.9% |
| 2021 | $3,057 +107.2% | $80,459 -5.8% |
| 2020 | $1,475 -49.8% | $85,457 +4.1% |
| 2019 | $2,940 +4.5% | $82,103 |
| 2018 | $2,814 -39.9% | $82,103 +12% |
| 2017 | $4,682 +25.7% | $73,283 |
| 2016 | $3,725 +8.3% | $73,283 -7.1% |
| 2015 | $3,440 +151.5% | $78,925 |
| 2014 | $1,368 | $78,925 |
| 2013 | -- | -- |
| 2012 | -- | -- |
| 2011 | -- | -- |
| 2010 | -- | -- |
| 2009 | $2,570 +4% | $197,312 +9.2% |
| 2008 | $2,471 -2.3% | $180,700 |
| 2007 | $2,529 +3.9% | $180,700 +150% |
| 2006 | $2,434 +2% | $72,280 |
| 2005 | $2,385 | $72,280 |
| 2004 | -- | $72,280 |
| 2003 | -- | $72,280 |
| 2002 | -- | $72,280 |
Find assessor info on the county website
Source: CGMLS. This data may not be complete. We recommend contacting the local school district to confirm school assignments for this home.
A local agent can set up tours, give advice and negotiate with sellers.
A local lender can help you make sure your offer is ready when you are.