Discover the essence of Cape Cod living at this waterfront retreat on Stage Harbor. Tucked away on a quiet lane yet close to Chatham Village, the property offers sweeping views with ever-changing tidal scenery, birdlife, and spectacular sunsets. The home features a welcoming coastal vibe with sun-filled living spaces, while outdoor areas are ideal for entertaining or quiet reflection. A firepit sets the stage for summer evenings, the perfect way to end the day toasting marshmallows. Whether enjoyed as a seasonal getaway or a year-round residence, 20 Cedar Swamp Lane captures the very best of Chatham. Buyers and agents, please verify all herein.
For sale
$995,000
20 Cedar Swamp Lane, Chatham, MA 02633
2beds
710sqft
Single Family Residence
Built in 1950
0.47 Acres Lot
$957,300 Zestimate®
$1,401/sqft
$-- HOA
What's special
Sun-filled living spacesSpectacular sunsetsWelcoming coastal vibe
- 24 days
- 2,196
- 100
Zillow last checked:
Listing updated:
Listed by:
Ellen Valentgas 508-648-5086,
Sotheby's International Realty
Source: CCIMLS,MLS#: 22605308
Facts & features
Interior
Bedrooms & bathrooms
- Bedrooms: 2
- Bathrooms: 1
- Full bathrooms: 1
Heating
- Electric
Cooling
- Central Air
Appliances
- Included: Electric, Water Heater
Features
- Flooring: Vinyl
- Number of fireplaces: 1
Interior area
- Total structure area: 710
- Total interior livable area: 710 sqft
Property
Features
- Stories: 1
- Exterior features: Outdoor Shower
- On waterfront: Yes
- Waterfront features: Waterview, Waterfront, Bay/Harbor
- Body of water: Stage Harbor,Salt
Lot
- Size: 0.47 Acres
- Features: Views
Details
- Parcel number: CHAT M:13B B:7 L:C30
- Special conditions: None
Construction
Type & style
- Home type: SingleFamily
- Property subtype: Single Family Residence
Materials
- Shingle Siding
- Roof: Asphalt
Condition
- Year built: 1950
Utilities & green energy
- Water: Public
Community & HOA
Location
- Region: Chatham
Financial & listing details
- Price per square foot: $1,401/sqft
- Tax assessed value: $870,800
- Annual tax amount: $3,015
- Date on market: 10/17/2026
- Cumulative days on market: 24 days
Estimated market value
$957,300
$909,000 - $1.01M
$2,632/mo
Price history
| Date | Event | Price |
|---|---|---|
| 10/17/2026 | Listed for sale | $995,000$1,401/sqft |
Source:  CCIMLS #22605308 Report a problem | ||
| 11/18/2025 | Listing removed | $995,000$1,401/sqft |
Source: MLS PIN #73435725 Report a problem | ||
| 9/25/2025 | Listed for sale | $995,000+10.7%$1,401/sqft |
Source: CCIMLS #22504796 Report a problem | ||
| 6/26/2024 | Listing removed | $899,000$1,266/sqft |
Source: CCIMLS #22400525 Report a problem | ||
| 5/6/2024 | Listed for sale | $899,000$1,266/sqft |
Source: MLS PIN #73233512 Report a problem | ||
| 4/30/2024 | Listing removed | $899,000$1,266/sqft |
Source: MLS PIN #73201509 Report a problem | ||
| 2/12/2024 | Listed for sale | $899,000+87.3%$1,266/sqft |
Source: MLS PIN #73201509 Report a problem | ||
| 2/15/2015 | Listing removed | $479,900$676/sqft |
Source: William Raveis Real Estate #21406470 Report a problem | ||
| 7/19/2014 | Listed for sale | $479,900-12.7%$676/sqft |
Source: William Raveis Real Estate #21406470 Report a problem | ||
| 1/1/2014 | Listing removed | $550,000$775/sqft |
Source: Prudential Howe & Doherty #71531316 Report a problem | ||
| 8/21/2013 | Price change | $550,000-4.3%$775/sqft |
Source: Prudential Howe & Doherty #71531316 Report a problem | ||
| 7/26/2013 | Price change | $575,000-3.4%$810/sqft |
Source: Prudential Howe & Doherty #71531316 Report a problem | ||
| 5/25/2013 | Price change | $595,000-0.7%$838/sqft |
Source: Prudential Howe & Doherty #71531316 Report a problem | ||
| 12/13/2012 | Price change | $599,000-7.1%$844/sqft |
Source: Chatham Properties Group #21205261 Report a problem | ||
| 8/12/2012 | Price change | $645,000+7.7%$908/sqft |
Source: Chatham Properties Group #71395182 Report a problem | ||
| 8/2/2012 | Price change | $599,000-7.1%$844/sqft |
Source: Chatham Properties Group #71395182 Report a problem | ||
| 6/9/2012 | Listed for sale | $645,000$908/sqft |
Source: Chatham Properties Group #21205261 Report a problem | ||
Public tax history
| Year | Property taxes | Tax assessment |
|---|---|---|
| 2025 | $2,768 +2.6% | $797,700 +5.5% |
| 2024 | $2,699 +8.4% | $756,100 +17.8% |
| 2023 | $2,491 -9.2% | $642,000 +8.1% |
| 2022 | $2,744 | $593,900 |
| 2021 | $2,744 -16.6% | $593,900 -13% |
| 2020 | $3,292 +10.1% | $683,000 +10.8% |
| 2019 | $2,991 +0.1% | $616,700 +0.5% |
| 2018 | $2,989 -0.5% | $613,800 +2.8% |
| 2017 | $3,003 +2.1% | $597,100 +1.9% |
| 2016 | $2,942 +13.2% | $586,100 +12.5% |
| 2015 | $2,600 -1.8% | $521,100 0% |
| 2014 | $2,648 -1.9% | $521,200 -2.9% |
| 2013 | $2,699 -29.5% | $536,600 -37.6% |
| 2012 | $3,826 +4% | $859,700 |
| 2011 | $3,680 +6.7% | $859,700 -4.7% |
| 2010 | $3,448 -1.5% | $902,500 -3.5% |
| 2009 | $3,500 +6.4% | $935,700 +4.4% |
| 2008 | $3,289 | $896,200 |
| 2007 | $3,289 +20.8% | $896,200 +22.8% |
| 2006 | $2,723 +28.2% | $730,000 +54.6% |
| 2005 | $2,124 | $472,100 |
| 2004 | $2,124 +15.5% | $472,100 +63.8% |
| 2003 | $1,839 +2.5% | $288,300 +10% |
| 2001 | $1,795 -6.2% | $262,100 +31.9% |
| 1998 | $1,913 | $198,700 |
Find assessor info on the county website
Monthly payment
Est. payment
Payment breakdown
Explore the cost of this home by adjusting the details. Changes won't be saved.Climate risks
Neighborhood: 02633
Similar homes
- $810,0001 bd2 ba768 sqft24 Deep Water Ln, South Chatham, MA 02659For Sale
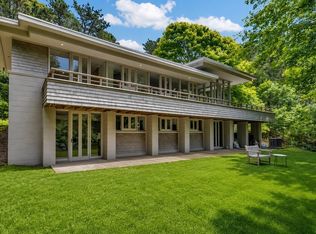 MLS ID #73557769, Karen St. Amand, Today Real Estate, Inc.. MLS PIN
- $619,0002 bd2 ba999 sqft216 Orleans Road UNIT D, North Chatham, MA 02650For Sale
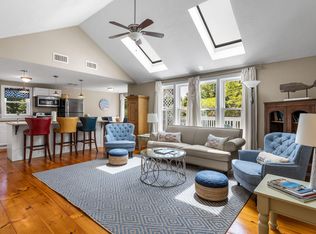
 MLS ID #22604294, Kathleen Phelan, Compass Massachusetts, LLC. CCIMLS
- $579,9002 bd1 ba912 sqft17 Longview Dr, Centerville, MA 02632For Sale
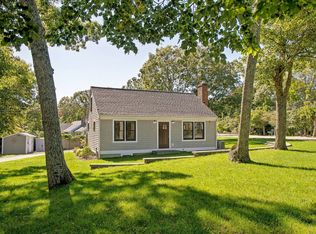 MLS ID #73599178, Kenneth Olson, eXp Realty LLC - Corporate Office. MLS PIN
- $675,0002 bd2 ba996 sqft210 Orleans Road #C, North Chatham, MA 02650For Sale
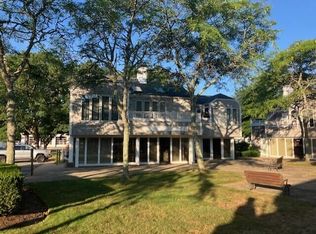 MLS ID #22604226, John B Burke, William Raveis Real Estate & Home Services. CCIMLS
- $540,0002 bd1 ba936 sqft488 Main Street, Harwich, MA 02645For SaleMLS ID #22605360, Jill S Cohen, Redfin Corporation. CCIMLS
- $774,0003 bd1 ba1k sqft33 Bain Road, Dennis Port, MA 02639For SaleMLS ID #22605524, Richard J Lonstein, Berkshire Hathaway HomeServices Robert Paul Properties. CCIMLS
- $565,0002 bd1 ba720 sqft49 Lakeview Drive, Harwich, MA 02645For SaleMLS ID #22604392, Mihaela Miteva, Today Real Estate. CCIMLS
- $535,0003 bd1 ba972 sqft37 REGIONAL Avenue, South Yarmouth, MA 02664For SaleMLS ID #22605540, Mike Karras, William Raveis Real Estate & Home Services. CCIMLS
- $659,0002 bd1 ba984 sqft165 Kingsbury Beach Road, Eastham, MA 02642For SaleMLS ID #22604777, Bob Sheldon, RE/MAX Real Estate Center. CCIMLS
- $535,0002 bd1 ba974 sqft142 Winslow Gray Road, West Yarmouth, MA 02673For SaleMLS ID #22605099, Michelle Chaisson-Turmelle, Today Real Estate. CCIMLS
- $515,0002 bd1 ba888 sqft50 Shallow Brook Road, South Yarmouth, MA 02664For SaleMLS ID #22605359, Ned B Chatelain, Chatelain Real Estate. CCIMLS
- $509,0001 bd1 ba792 sqft4 Rosetta Street, West Yarmouth, MA 02673For SaleMLS ID #22605605, Karen D Lilly, Property Cape Cod. CCIMLS
- $587,0003 bd1 ba1k sqft28 Lakefield Road, South Yarmouth, MA 02664For SaleMLS ID #22605347, Thiago L Monteiro, William Raveis Real Estate & Home Services. CCIMLS
- $590,0002 bd1 ba720 sqft15 Alice Road, Eastham, MA 02642For SaleMLS ID #22603998, Whitaker Group Cape Cod, Gibson Sotheby's International Realty. CCIMLS
- $699,9002 bd1 ba868 sqft24 Honeysuckle Lane, Dennis Port, MA 02639For SaleMLS ID #22605013, Michele DeMango, Today Real Estate. CCIMLS
- $599,0002 bd1 ba928 sqft46 Longell Road, Dennis Port, MA 02639For SaleMLS ID #22604464, Falconio Jones Team, Kinlin Grover Compass. CCIMLS
- $525,0002 bd1 ba944 sqft32 Powhatan Road, South Yarmouth, MA 02664For SaleMLS ID #22605351, Aaron O'Brien, Keller Williams Realty. CCIMLS
