Another great deal in Lancaster Ca! This mobile home is located in Golden Sands mobile home park. Where space rent is affordable and living is comfortable. This 1968 Newmoon Mobile Home offers a 2 bedroom 2 bath with 1152 sqft. With several updates that will make it easy to settle quickly. Spacious floor plan making ideas for the new buyer infinite. Must be approved by the mobile home park.
For sale
Listed by: eXp Realty of California Inc • Jorge Huerta Fuentes • Contact: 661-468-0402
$99,000
2059 E Avenue I Space 47, Lancaster, CA 93535
2beds
1,152sqft
Manufactured Home
Built in 1968
-- sqft lot
$95,600 Zestimate®
$86/sqft
$-- HOA
What's special
- 26 days
- 391
- 29
Zillow last checked:
Listing updated:
Listed by:
Jorge Huerta Fuentes DRE #02164206 661-468-0402,
eXp Realty of California Inc
Source: CRMLS,MLS#: SR26211763 Originating MLS: California Regional MLS
Facts & features
Interior
Bedrooms & bathrooms
- Bedrooms: 2
- Bathrooms: 2
- Full bathrooms: 2
Appliances
- Laundry: Inside
Interior area
- Total interior livable area: 1,152 sqft
Property
Parking
- Total spaces: 2
- Parking features: Garage
- Garage spaces: 2
Features
- Entry location: side
- Pool features: Community
- Park: Golden Sands Mobile Home Park
Lot
- Features: 0-1 Unit/Acre
Details
- Parcel number: 8950135047
- On leased land: Yes
- Lease amount: $700
- Special conditions: Standard
Construction
Type & style
- Home type: MobileManufactured
- Property subtype: Manufactured Home
Condition
- Year built: 1968
Utilities & green energy
- Sewer: Public Sewer
- Water: Public
Community & HOA
Community
- Features: Dog Park, Pool
Location
- Region: Lancaster
Financial & listing details
- Price per square foot: $86/sqft
- Tax assessed value: $10,740
- Date on market: 9/29/2026
- Cumulative days on market: 26 days
- Listing terms: Cash,Conventional
Estimated market value
$95,600
$91,000 - $100,000
Not available
Price history
| Date | Event | Price |
|---|---|---|
| 9/30/2026 | Listed for sale | $99,000$86/sqft |
Source: eXp Realty #SR26211763 Report a problem | ||
| 9/24/2026 | Listing removed | $99,000$86/sqft |
Source:  GAVAR #26004050 Report a problem | ||
| 9/11/2026 | Price change | $99,000-10%$86/sqft |
Source: GAVAR #26004050 Report a problem | ||
| 5/21/2026 | Listed for sale | $110,000+22.2%$95/sqft |
Source: GAVAR #26004050 Report a problem | ||
| 5/21/2026 | Listing removed | $90,000$78/sqft |
Source: GAVAR #26000262 Report a problem | ||
| 1/12/2026 | Listed for sale | $90,000+50%$78/sqft |
Source: GAVAR #26000262 Report a problem | ||
| 1/29/2025 | Sold | $60,000$52/sqft |
Source: GAVAR #24005511 Report a problem | ||
| 12/19/2024 | Pending sale | $60,000$52/sqft |
Source: GAVAR #24005511 Report a problem | ||
| 12/10/2024 | Price change | $60,000-7.6%$52/sqft |
Source: GAVAR #24005511 Report a problem | ||
| 11/18/2024 | Price change | $64,900-3.1%$56/sqft |
Source: GAVAR #24005511 Report a problem | ||
| 10/28/2024 | Price change | $67,000-2.9%$58/sqft |
Source: GAVAR #24005511 Report a problem | ||
| 10/9/2024 | Listed for sale | $69,000$60/sqft |
Source: GAVAR #24005511 Report a problem | ||
| 8/26/2024 | Pending sale | $69,000$60/sqft |
Source: GAVAR #24005511 Report a problem | ||
| 8/14/2024 | Price change | $69,000-13.8%$60/sqft |
Source: GAVAR #24005511 Report a problem | ||
| 7/25/2024 | Listed for sale | $80,000$69/sqft |
Source: GAVAR #24005511 Report a problem | ||
Public tax history
| Year | Property taxes | Tax assessment |
|---|---|---|
| 2026 | -- | $10,740 -7.4% |
| 2025 | $262 +8% | $11,602 +1.7% |
| 2024 | $242 -7% | $11,407 -14.8% |
| 2023 | $260 +0.7% | $13,393 +2.8% |
| 2022 | $259 +10.4% | $13,031 +14% |
| 2021 | $234 +2.4% | $11,428 +2.5% |
| 2020 | $229 | $11,144 +2.9% |
| 2019 | $229 +0.8% | $10,833 |
| 2018 | $227 | $10,833 |
| 2017 | $227 +2.7% | -- |
| 2016 | $221 +10.1% | -- |
| 2015 | $201 -1.3% | -- |
| 2014 | $203 | -- |
| 2012 | -- | -- |
| 2011 | -- | $10,454 -3.2% |
| 2010 | -- | $10,800 -10.7% |
| 2008 | -- | $12,098 0% |
| 2007 | -- | $12,100 |
Find assessor info on the county website
Monthly payment
Climate risks
Neighborhood: 93535
- $96,200-- bd-- ba756 sqft2059 E Avenue I SPACE 1, Lancaster, CA 93535Off Market
- $83,800-- bd-- ba720 sqft2059 E Avenue I SPACE 12, Lancaster, CA 93535Off Market
- $83,400-- bd-- ba672 sqft2059 E Avenue I SPACE 29, Lancaster, CA 93535Off Market
- $109,800-- bd-- ba1k sqft2059 E Avenue I SPACE 37, Lancaster, CA 93535Off Market
Similar homes
- $99,9003 bd2 ba1k sqft3157 E I Ave #E2, Lancaster, CA 93535For Sale
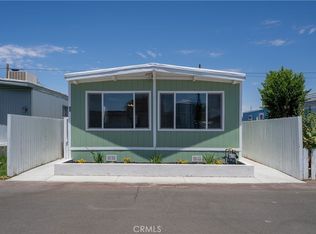 MLS ID #SR26220129, Douglas Terrell, Berkshire Hathaway HomeServices Troth, Realtors. CRMLS
- $99,9003 bd2 ba1k sqft3157 E Avenue I Space E2, Lancaster, CA 93535For Sale
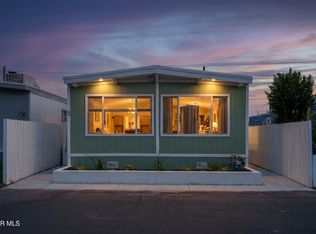 MLS ID #26007802, Douglas L Terrell. GAVAR
- $94,9902 bd2 ba1k sqft45415 28th St E #66, Lancaster, CA 93535For Sale
 MLS ID #26005783, Elizabeth C Gonzalez. GAVAR
- $89,9902 bd2 ba960 sqft45415 28th St E Spc 9, Lancaster, CA 93535For Sale
 MLS ID #26007193, Elizabeth C Gonzalez. GAVAR
