Investment opportunity in the heart of Ypsilanti! This fully occupied 4-unit property generates current contractual base rent of $6,265/month, or $75,180 annually, with leases extending into 2027. Available records indicate an attractive unit mix consisting of a spacious 3-bedroom unit, two 1-bedroom units and one 2-bedroom unit. Current monthly rents are $2,300, $1,300, $1,365 and $1,300. Recent ownership has completed a number of repairs, improvements and unit updates. Strong current income and an established rental history provide an appealing opportunity for an investor looking to add a well-positioned multi-unit property to their portfolio. Conveniently located near Downtown Ypsilanti, Eastern Michigan University, shopping, dining and area amenities. Financial information and leases available for review. Buyer/Buyer's Agent to independently verify unit configurations, property information, income, expenses and future property taxes.
Active
$475,000
206 S Huron St, Ypsilanti, MI 48197
8beds
6baths
--sqft
2 to 4 Units
Built in 1873
-- sqft lot
$459,600 Zestimate®
$--/sqft
$-- HOA
What's special
- 15 days
- 337
- 24
Zillow last checked:
Listing updated:
Listed by:
Brian Bundesen 734-678-9032,
Real Estate One Inc 734-662-8600
Source: MichRIC,MLS#: 26053240
Facts & features
Interior
Bedrooms & bathrooms
- Bedrooms: 8
- Bathrooms: 6
Heating
- Forced Air, Hot Water, Radiant
Appliances
- Laundry: In Basement
Features
- Basement: Michigan Basement
Property
Parking
- Total spaces: 5
- Parking features: Driveway, Gravel
Lot
- Size: 0.26 Acres
- Dimensions: 74 x 165
Details
- Parcel number: 111139411010
Construction
Type & style
- Home type: MultiFamily
- Property subtype: 2 to 4 Units
Materials
- Stone, Wood Siding
Condition
- New construction: No
- Year built: 1873
Utilities & green energy
- Sewer: Public Sewer
- Utilities for property: Natural Gas Connected, Electricity Connected
Community & HOA
Location
- Region: Ypsilanti
Financial & listing details
- Tax assessed value: $139,733
- Annual tax amount: $11,172
- Date on market: 10/6/2026
- Listing terms: Cash,Conventional
- Tenant pays: Electricity, Water, Gas
- Electric utility on property: Yes
Estimated market value
$459,600
$437,000 - $483,000
$1,375/mo
Price history
| Date | Event | Price |
|---|---|---|
| 10/6/2026 | Listed for sale | $475,000+14.5% |
Source:  MichRIC #26053240 Report a problem | ||
| 7/2/2026 | Price change | $1,300+4.8% |
Source: Zillow Rentals Report a problem | ||
| 6/10/2026 | Price change | $1,240-4.6% |
Source: Zillow Rentals Report a problem | ||
| 4/17/2026 | Price change | $1,300+4.8% |
Source: Zillow Rentals Report a problem | ||
| 4/9/2026 | Price change | $1,240-46.1% |
Source: Zillow Rentals Report a problem | ||
| 4/8/2026 | Price change | $2,300+85.5% |
Source: Zillow Rentals Report a problem | ||
| 3/31/2026 | Listed for rent | $1,240-46.1% |
Source: Zillow Rentals Report a problem | ||
| 6/11/2024 | Price change | $2,300+110% |
Source: Zillow Rentals Report a problem | ||
| 5/22/2024 | Price change | $1,095-57.9% |
Source: Zillow Rentals Report a problem | ||
| 12/14/2023 | Listed for rent | $2,600+137.4% |
Source: Zillow Rentals Report a problem | ||
| 6/15/2023 | Listed for rent | $1,095-57.9% |
Source: Zillow Rentals Report a problem | ||
| 6/15/2023 | Listing removed | -- |
Source: Zillow Rentals Report a problem | ||
| 6/5/2023 | Listed for rent | $2,600+137.4% |
Source: Zillow Rentals Report a problem | ||
| 4/27/2023 | Listing removed | -- |
Source: Zillow Rentals Report a problem | ||
| 4/26/2023 | Listed for rent | $1,095 |
Source: Zillow Rentals Report a problem | ||
| 4/4/2023 | Listing removed | -- |
Source: Zillow Rentals Report a problem | ||
| 4/2/2023 | Listed for rent | $1,095 |
Source: Zillow Rentals Report a problem | ||
| 3/25/2023 | Listing removed | -- |
Source: Zillow Rentals Report a problem | ||
| 3/24/2023 | Listed for rent | $1,095-63.5% |
Source: Zillow Rentals Report a problem | ||
| 3/17/2023 | Listing removed | -- |
Source: Zillow Rentals Report a problem | ||
| 3/16/2023 | Listed for rent | $3,000+3.4% |
Source: Zillow Rentals Report a problem | ||
| 10/18/2021 | Listing removed | -- |
Source:  AAABOR Report a problem | ||
| 10/13/2021 | Price change | $2,900-17.1% |
Source: AAABOR #3283498 Report a problem | ||
| 10/6/2021 | Listed for rent | $3,500 |
Source: AAABOR #3283498 Report a problem | ||
| 8/10/2021 | Sold | $415,000 |
Source: Public Record Report a problem | ||
| 8/7/2021 | Listing removed | -- |
Source: Zillow Rental Network_1 Report a problem | ||
Public tax history
| Year | Property taxes | Tax assessment |
|---|---|---|
| 2026 | $11,172 +1.7% | $199,900 +13.4% |
| 2025 | $10,982 | $176,300 +10.9% |
| 2024 | -- | $159,000 +14.5% |
| 2023 | -- | $138,900 +16% |
| 2022 | -- | $119,700 +10.6% |
| 2021 | -- | $108,200 +9.8% |
| 2020 | $6,382 | $98,500 +3.6% |
| 2019 | -- | $95,100 +12% |
| 2018 | -- | $84,900 +1.9% |
| 2017 | $5,731 | $83,300 +25.7% |
| 2016 | $5,731 | $66,262 +0.3% |
| 2015 | -- | $66,064 -2.3% |
| 2014 | -- | $67,600 |
| 2013 | -- | $67,600 -1.7% |
| 2012 | -- | $68,753 +2.7% |
| 2011 | -- | $66,946 +1.7% |
| 2010 | -- | $65,827 -0.3% |
| 2009 | -- | $66,026 +4.4% |
| 2008 | -- | $63,244 +2.3% |
| 2007 | -- | $61,823 -48.9% |
| 2005 | -- | $120,900 +4.9% |
| 2004 | -- | $115,300 +8.1% |
| 2003 | -- | $106,700 +12% |
| 2002 | $3,858 +18.4% | $95,300 +13.3% |
| 2001 | $3,260 +56.3% | $84,100 +22.4% |
| 2000 | $2,086 +156.7% | $68,700 +5.2% |
| 1999 | $813 | $65,300 |
Find assessor info on the county website
Monthly payment
Est. payment
Payment breakdown
Explore the cost of this home by adjusting the details. Changes won't be saved.Climate risks
Neighborhood: Historic South Side


Similar homes
- $475,0009 bd5 ba-- sqft11 S Summit St, Ypsilanti, MI 48197For Sale
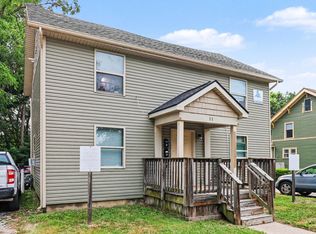
 MLS ID #26042179, Ayad Ridha, The Charles Reinhart Company. MichRIC
- $495,0009 bd4 ba-- sqft124 N Summit St, Ypsilanti, MI 48197For Sale
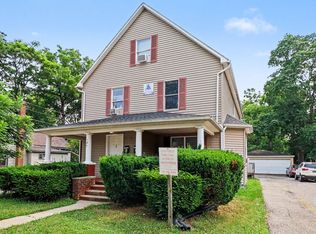 MLS ID #26042161, Ayad Ridha, The Charles Reinhart Company. MichRIC
- $452,0009 bd4 ba3.1k sqft608 Pearl St, Ypsilanti, MI 48197For Sale
 MLS ID #26030501, Eduardo Herrera-Urena, Beal Properties LLC. MichRIC
- $585,0006 bd6 ba-- sqft105 N Adams St, Ypsilanti, MI 48197For Sale
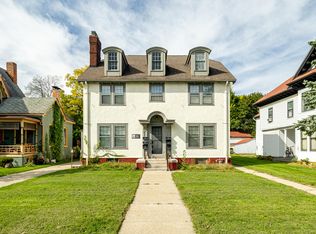 MLS ID #26054094, Natalie Jean, @properties Christie's Int'lAA. MichRIC
- $549,00010 bd8 ba-- sqft615 Pearl St, Ypsilanti, MI 48197For SaleMLS ID #26042175, Ayad Ridha, The Charles Reinhart Company. MichRIC
- $349,9007 bd4 ba4k sqft217 N Normal St, Ypsilanti, MI 48197For Sale
 MLS ID #20261078875, Colleen Kennedy, Prospect Realty Group. Realcomp II
- $385,0008 bd5 ba3.9k sqft430 N Adams St, Ypsilanti, MI 48197For SaleMLS ID #20261071099, Charise Hinton, Hinton Real Estate Group. Realcomp II
- $395,00010 bd8 ba4.3k sqft126 College Pl, Ypsilanti, MI 48197For SaleMLS ID #20261041496, Colleen Kennedy, Prospect Realty Group. Realcomp II
- $475,0005 bd3 ba2.3k sqft9582 Falmouth Dr, Ypsilanti, MI 48197For SaleMLS ID #26054251, Tyler Weston, Real Estate One Inc. MichRIC
- $349,0005 bd4 ba-- sqft106 N Summit St, Ypsilanti, MI 48197For SaleMLS ID #26042167, Ayad Ridha, The Charles Reinhart Company. MichRIC
- $395,0009 bd2 ba-- sqft718 Lowell St, Ypsilanti, MI 48197For SaleMLS ID #26042207, Ayad Ridha, The Charles Reinhart Company. MichRIC
- $319,0006 bd3 ba-- sqft116 N Summit St, Ypsilanti, MI 48197For SaleMLS ID #26042181, Ayad Ridha, The Charles Reinhart Company. MichRIC
- $319,0006 bd3 ba-- sqft125 N Summit St, Ypsilanti, MI 48197For SaleMLS ID #26014509, Ayad Ridha, The Charles Reinhart Company. MichRIC
- $299,0005 bd2 ba-- sqft351 S Mansfield St, Ypsilanti, MI 48197For SaleMLS ID #26042157, Ayad Ridha, The Charles Reinhart Company. MichRIC
- $299,0006 bd3 ba-- sqft118 Ballard St, Ypsilanti, MI 48197For SaleMLS ID #26042178, Ayad Ridha, The Charles Reinhart Company. MichRIC
- $275,0006 bd-- ba-- sqft309 Ballard St, Ypsilanti, MI 48197For SaleMLS ID #26053352, Scott Bethune, The Charles Reinhart Company. MichRIC
- $239,0005 bd2 ba-- sqft9 S Summit St, Ypsilanti, MI 48197For SaleMLS ID #26042169, Ayad Ridha, The Charles Reinhart Company. MichRIC
- $419,9005 bd2 ba2.1k sqft314 E Cross St, Ypsilanti, MI 48198For SaleMLS ID #26024923, Jodi Douglas, Howard Hanna Real Estate. MichRIC
- $360,0005 bd2 ba2.2k sqft512 N Hamilton St, Ypsilanti, MI 48197For SaleMLS ID #26035631, Betsy Stover, The Charles Reinhart Company. MichRIC
- $355,3005 bd2 ba1.8k sqft612 Pearl St, Ypsilanti, MI 48197For SaleMLS ID #26030502, Eduardo Herrera-Urena, Beal Properties LLC. MichRIC
