Come home to this Renovated Single Family home in desirable East Grand Park! Tastefully updated from top to bottom! Including **2024 Plumbing , 2023 Electrical 200amp service upgrade, Newer Roof, HVAC plus +many custom updates including *Quartz counters ,Luxury wood LVP flooring and tile throughout , renovated Kitchen and Bathroom with W&D Hookups! Fenced in situated high and dry with gated off street parking! Enjoy the private back yard and extended driveway for rear parking with room for a carport. Perfect for a family with desirable location close to schools , parks, Hospitals and Highway. Schedule your tour today! ** FHA and VA welcome!!
Active
Price cut: $1K (10/13)
$128,900
2075 W 13TH Street, Jacksonville, FL 32209
3beds
1,064sqft
Single Family Residence
Built in 1949
4,791 Square Feet Lot
$-- Zestimate®
$121/sqft
$-- HOA
What's special
Fenced inRenovated kitchenQuartz countersSituated high and dryGated off street parkingRoom for a carport
- 29 days
- 310
- 27
Zillow last checked:
Listing updated:
Listed by:
BRIAN LOVE 904-223-4116,
FLORIDA HOMES REALTY & MTG LLC 904-996-9115
Source: realMLS,MLS#: 2165613
Facts & features
Interior
Bedrooms & bathrooms
- Bedrooms: 3
- Bathrooms: 1
- Full bathrooms: 1
Heating
- Central
Cooling
- Central Air
Appliances
- Included: Electric Range, Microwave
Interior area
- Total interior livable area: 1,064 sqft
Property
Parking
- Parking features: Gated, Off Street
Features
- Stories: 1
Lot
- Size: 4,791 Square Feet
Details
- Parcel number: 0472050000
Construction
Type & style
- Home type: SingleFamily
- Property subtype: Single Family Residence
Condition
- New construction: No
- Year built: 1949
Utilities & green energy
- Water: Public
- Utilities for property: Electricity Connected, Water Connected
Community & HOA
Community
- Subdivision: East Grand Park
HOA
- Has HOA: No
Location
- Region: Jacksonville
Financial & listing details
- Price per square foot: $121/sqft
- Tax assessed value: $110,947
- Annual tax amount: $2,322
- Date on market: 9/19/2026
- Listing terms: Cash,Conventional,FHA,VA Loan
Estimated market value
Not available
Estimated sales range
Not available
$1,214/mo
Price history
| Date | Event | Price |
|---|---|---|
| 10/13/2026 | Price change | $128,900-0.8%$121/sqft |
Source:  realMLS #2165613 Report a problem | ||
| 9/19/2026 | Listed for sale | $129,900+106.2%$122/sqft |
Source: realMLS #2165613 Report a problem | ||
| 9/13/2024 | Listing removed | $1,350$1/sqft |
Source: Zillow Rentals Report a problem | ||
| 7/12/2024 | Listed for rent | $1,350+3.8%$1/sqft |
Source: Zillow Rentals Report a problem | ||
| 1/30/2024 | Sold | $63,000-19.2%$59/sqft |
Source: Public Record Report a problem | ||
| 10/28/2022 | Sold | $78,000+1.4%$73/sqft |
Source: realMLS #1191277 Report a problem | ||
| 10/27/2022 | Pending sale | $76,900$72/sqft |
Source: realMLS #1191277 Report a problem | ||
| 10/26/2022 | Listing removed | -- |
Source: Zillow Rental Network_1 Report a problem | ||
| 10/3/2022 | Price change | $76,900-3.8%$72/sqft |
Source: realMLS #1191277 Report a problem | ||
| 9/12/2022 | Listed for sale | $79,900-21.7%$75/sqft |
Source: realMLS #1191277 Report a problem | ||
| 6/14/2022 | Listing removed | $102,000$96/sqft |
Source: realMLS #1171315 Report a problem | ||
| 6/6/2022 | Listed for rent | $1,300+333.3%$1/sqft |
Source: Zillow Rental Network_1 Report a problem | ||
| 5/25/2022 | Listed for sale | $102,000+25%$96/sqft |
Source: realMLS #1171315 Report a problem | ||
| 4/10/2022 | Listing removed | -- |
Source: Owner Report a problem | ||
| 3/7/2022 | Listed for sale | $81,600+3038.5%$77/sqft |
Source: Owner Report a problem | ||
| 4/11/2019 | Listing removed | $300 |
Source: Helpful Citizens Inc Report a problem | ||
| 4/10/2019 | Price change | $300-60% |
Source: Helpful Citizens Inc Report a problem | ||
| 3/27/2019 | Listed for rent | $750+25%$1/sqft |
Source: Helpful Citizens Inc Report a problem | ||
| 10/16/2014 | Listing removed | $600$1/sqft |
Source: Zillow Rental Network Report a problem | ||
| 8/12/2014 | Listed for rent | $600$1/sqft |
Source: Helpful Citizens Inc Report a problem | ||
| 1/7/2014 | Sold | $2,600$2/sqft |
Source: Public Record Report a problem | ||
Public tax history
| Year | Property taxes | Tax assessment |
|---|---|---|
| 2025 | $2,322 +102.5% | $110,947 +105.4% |
| 2024 | $1,147 +3.1% | $54,005 +4.3% |
| 2023 | $1,112 +511.4% | $51,782 +34.7% |
| 2022 | $182 | $38,449 +10% |
| 2021 | $182 | $34,954 +10% |
| 2020 | $182 | $31,777 +5.2% |
| 2019 | $182 | $30,213 +1.9% |
| 2018 | $182 | $29,661 +2.9% |
| 2017 | $182 | $28,834 +5.3% |
| 2016 | $182 | $27,386 +1% |
| 2015 | $182 | $27,110 -0.5% |
| 2014 | $182 | $27,248 -10.9% |
| 2013 | -- | $30,591 -3.2% |
| 2012 | -- | $31,602 -41.9% |
| 2011 | -- | $54,370 +97.8% |
| 2010 | -- | $27,484 +2.7% |
| 2009 | -- | $26,762 +5.7% |
| 2006 | -- | $25,325 +3% |
| 2005 | -- | $24,587 +3% |
| 2004 | -- | $23,871 +1.9% |
| 2003 | -- | $23,426 +2.4% |
| 2002 | -- | $22,877 +1.6% |
| 2001 | -- | $22,517 +3% |
| 2000 | -- | $21,861 +2.7% |
| 1999 | -- | $21,286 |
Find assessor info on the county website
Monthly payment
Est. payment
Payment breakdown
Explore the cost of this home by adjusting the details. Changes won't be saved.Climate risks
Neighborhood: Mid-Westside
Similar homes
- $119,0003 bd1 ba827 sqft1753 W 12TH Street, Jacksonville, FL 32209For Sale
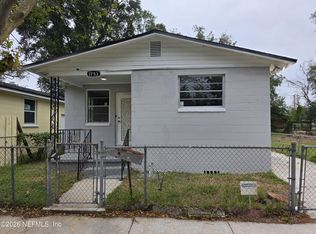 MLS ID #2169764, CHERYL HORACE. realMLS
- $119,9003 bd2 ba1k sqft1922 MACLEAN Road, Jacksonville, FL 32209For Sale
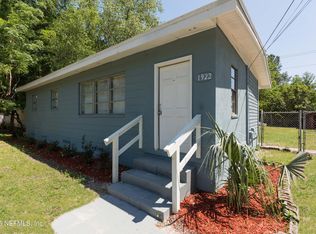 MLS ID #2169572, MOSES R NAE. realMLS
- $135,0003 bd2 ba1k sqft1585 W 15TH Street, Jacksonville, FL 32209For Sale
 MLS ID #2168128, CHAD NEUMANN. realMLS
- $124,9003 bd2 ba1.4k sqft3880 SPRINGROVE Street, Jacksonville, FL 32209For Sale
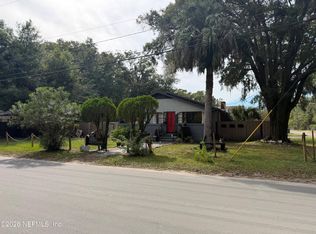 MLS ID #2167259, SCOTT W FADER. realMLS
