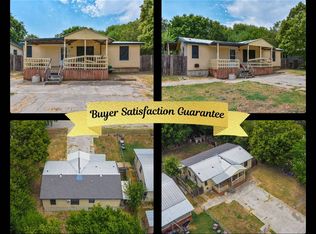
Duplex brick 2 units. Huge completely fenced backyard 38 acre park across street. This is a investors dream. Rents 850.00 mo.
For sale by owner
$110,000
208 E Turnbo Rd, Harker Heights, TX 76548
2beds
1,056sqft
MultiFamily
Built in 1985
-- sqft lot
$-- Zestimate®
$104/sqft
$-- HOA
What's special
Huge completely fenced backyard
What the owner loves about this home
Quiet, fully functional , close to schools , hospitals
Huge 100 yr old oak tree in backyard great canopy
Most everything you need within 2 miles. Has optic fiber for internet
- 28 days
- 505
- 40
Listed by:
Property Owner (254) 922-1257
Facts & features
Interior
Bedrooms & bathrooms
- Bedrooms: 2
- Bathrooms: 2
- Full bathrooms: 2
Heating
- Other
Cooling
- Other
Appliances
- Included: Microwave, Range / Oven, Refrigerator
Features
- Flooring: Other
- Basement: None
Interior area
- Total interior livable area: 1,056 sqft
Property
Parking
- Total spaces: 4
Features
- Exterior features: Brick
- Has view: Yes
- View description: Territorial
Lot
- Size: 5,856 Square Feet
Details
- Parcel number: 69190
Construction
Type & style
- Home type: MultiFamily
Materials
- brick
- Foundation: Crawl/Raised
- Roof: Composition
Condition
- New construction: No
- Year built: 1985
Community & HOA
Location
- Region: Harker Heights
Financial & listing details
- Price per square foot: $104/sqft
- Tax assessed value: $77,339
- Annual tax amount: $800
- Date on market: 9/29/2026
Estimated market value
Not available
Estimated sales range
Not available
$1,169/mo
Price history
| Date | Event | Price |
|---|---|---|
| 9/29/2026 | Listed for sale | $110,000+162.5%$104/sqft |
Source: Owner Report a problem | ||
| 7/11/2015 | Listing removed | $41,900$40/sqft |
Source: Clyde Cone Company #49844328 Report a problem | ||
| 3/18/2015 | Listed for sale | $41,900$40/sqft |
Source: Clyde Cone Company #49844328 Report a problem | ||
Public tax history
| Year | Property taxes | Tax assessment |
|---|---|---|
| 2025 | $800 +2.7% | $77,339 +0.9% |
| 2024 | $779 +8.7% | $76,632 +35.5% |
| 2023 | $716 -31.8% | $56,572 +11% |
| 2022 | $1,050 | $50,955 +54.6% |
| 2021 | -- | $32,966 +8.1% |
| 2020 | $716 +86.5% | $30,489 +94.6% |
| 2019 | $384 -12.7% | $15,669 -8.7% |
| 2018 | $439 -8.3% | $17,159 -8% |
| 2017 | $479 | $18,649 -5.7% |
| 2016 | $479 -10.6% | $19,767 -7% |
| 2015 | $536 | $21,257 -5% |
| 2014 | $536 | $22,374 -6.2% |
| 2013 | -- | $23,864 -4.5% |
| 2012 | -- | $24,981 -4.3% |
| 2011 | -- | $26,099 -4.1% |
| 2010 | -- | $27,216 -3.9% |
| 2009 | -- | $28,334 -3.8% |
| 2008 | -- | $29,451 +47.6% |
| 2007 | -- | $19,957 -4.9% |
| 2006 | -- | $20,992 -2.3% |
| 2005 | -- | $21,485 -18.7% |
| 2004 | -- | $26,411 |
| 2003 | -- | $26,411 -1.2% |
| 2002 | -- | $26,740 |
| 2001 | -- | $26,740 |
| 2000 | -- | $26,740 |
Find assessor info on the county website
Monthly payment
Est. payment
Payment breakdown
Explore the cost of this home by adjusting the details. Changes won't be saved.Climate risks
Neighborhood: 76548


Similar homes
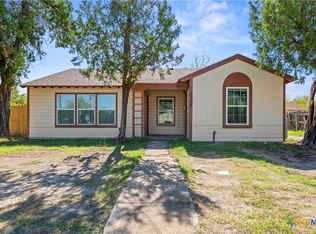
- $89,9003 bd2 ba1.1k sqft906 Ashwood St, Harker Heights, TX 76548For Sale
 MLS ID #11962308, Shelly Salas, Your Home SOLD Guaranteed Realty Shelly Salas. My State MLS
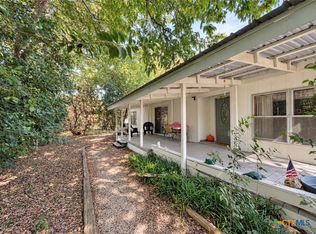
- $120,0002 bd2 ba1.3k sqft1308 Terrace Dr, Killeen, TX 76541Active
 MLS ID #628360, Vernon MacHardy, Coldwell Banker Realty. Central Texas MLS
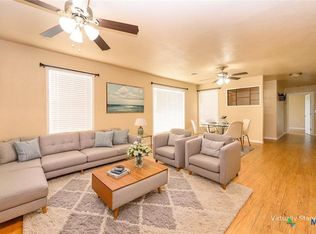
- $72,5003 bd2 ba1.4k sqft221 Clore Rd, Harker Heights, TX 76548Active
 MLS ID #627947, David Baca, Casora Realty. Central Texas MLS
- $135,0003 bd2 ba1.2k sqft104 W Beeline Ln, Harker Heights, TX 76548Active
 MLS ID #609773, Scott Shine, Coldwell Banker Apex, Realtors. Central Texas MLS
- $120,0004 bd2 ba1.5k sqft1806 Cedarhill Dr, Killeen, TX 76543ActiveMLS ID #615931, Laron Phillips, Levi Rodgers Real Estate Group. Central Texas MLS
- $165,0003 bd2 ba1.3k sqft1602 Indian Trl, Harker Heights, TX 76548ActiveMLS ID #600648, Daisy Ruiz, All City Real Estate. Central Texas MLS
- $74,9003 bd2 ba1.1k sqft214 W Beeline Ln, Harker Heights, TX 76548ActiveMLS ID #556074, Melissa Reyes, Redbird Realty Llc. Central Texas MLS
- $145,0003 bd2 ba1k sqft3114 Panhandle Dr, Killeen, TX 76542ActiveMLS ID #628477, Gabriel Granado, Aspire Realty Group. Central Texas MLS
- $155,0003 bd2 ba1.2k sqft103 E Cherokee Dr, Harker Heights, TX 76548ActiveMLS ID #620050, Jose Cazarez, Homestead Real Estate. Central Texas MLS
- $120,0003 bd1 ba948 sqft801 S 2nd St, Killeen, TX 76541ActiveMLS ID #628379, Ramon Alvarez, All City Real Estate. Central Texas MLS
- $99,0003 bd1 ba925 sqft824 Southside Dr, Killeen, TX 76541ActiveMLS ID #628472, Jack McLemore, Listing Results, LLC. Central Texas MLS
- $99,9002 bd1 ba750 sqft913 Rev R A Abercrombie Dr, Killeen, TX 76543ActiveMLS ID #628120, Jeremy Ellis, Anchor Realty. Central Texas MLS
- $115,0002 bd2 ba1.1k sqft1004 Cedar Dr, Killeen, TX 76543ActiveMLS ID #613510, Tina Thomas, Spur Creek Realty LLC. Central Texas MLS
- $112,9003 bd1 ba1k sqft111 W Vardeman Ave, Killeen, TX 76541ActiveMLS ID #619402, Jean Augustin, Jim Wright Company. Central Texas MLS
- $104,9002 bd1 ba864 sqft1202 Stewart St, Killeen, TX 76541ActiveMLS ID #624537, Jared English, Congress Realty. Central Texas MLS
- $109,1155 bd2 ba1.5k sqft1104 Nolan Ave, Killeen, TX 76541ActiveMLS ID #620632, Jim Wright, Jim Wright Company. Central Texas MLS
- $119,9994 bd2 ba1.1k sqft1505 N West S Young Dr, Killeen, TX 76543ActiveMLS ID #625692, Zulma Nevarez, Redbird Realty Llc. Central Texas MLS
- $105,0003 bd1 ba1.1k sqft1104 N 10th St, Killeen, TX 76541ActiveMLS ID #613765, Marisol Cordero, Keller Williams Realty, Waco. Central Texas MLS
