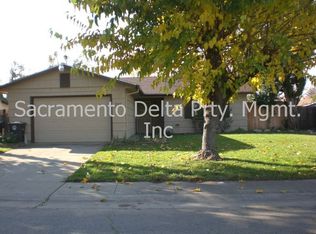
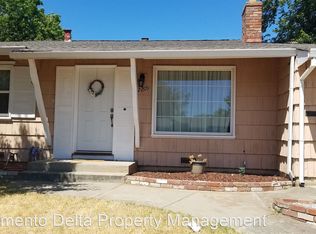
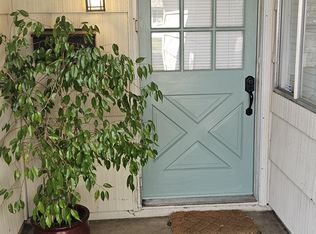
This 1013 square foot single family home has 3 bedrooms and 1.5 bathrooms. This home is located at 2108 Pantages Cir, Rancho Cordova, CA 95670.
Pre-foreclosure
Street View
Est. $435,500
2108 Pantages Cir, Rancho Cordova, CA 95670
3beds
1baths
1,013sqft
SingleFamily
Built in 1971
7,361 Square Feet Lot
$435,500 Zestimate®
$430/sqft
$-- HOA
Overview
- 86 days |
- 29 |
- 0 |
Facts & features
Interior
Bedrooms & bathrooms
- Bedrooms: 3
- Bathrooms: 1.5
Heating
- Other
Cooling
- Central
Interior area
- Total interior livable area: 1,013 sqft
Property
Parking
- Parking features: Garage - Attached
Lot
- Size: 7,361 Square Feet
Details
- Parcel number: 05602500320000
Construction
Type & style
- Home type: SingleFamily
Materials
- wood frame
- Roof: Composition
Condition
- Year built: 1971
Community & HOA
Location
- Region: Rancho Cordova
Financial & listing details
- Price per square foot: $430/sqft
- Tax assessed value: $330,000
- Annual tax amount: $4,391
Visit our professional directory to find a foreclosure specialist in your area that can help with your home search.
Find a foreclosure agentForeclosure details
Estimated market value
$435,500
$409,000 - $462,000
$2,561/mo
Price history
| Date | Event | Price |
|---|---|---|
| 12/16/2024 | Sold | $253,000+182.7%$250/sqft |
Source: Public Record Report a problem | ||
| 4/24/2012 | Sold | $89,500-51.6%$88/sqft |
Source: Public Record Report a problem | ||
| 2/26/2003 | Sold | $185,000+125750.3%$183/sqft |
Source: Public Record Report a problem | ||
| 10/11/2002 | Sold | $147 |
Source: Public Record Report a problem | ||
Public tax history
| Year | Property taxes | Tax assessment |
|---|---|---|
| 2025 | $4,391 +85.8% | $330,000 +199.5% |
| 2024 | $2,363 +73.3% | $110,199 +2% |
| 2023 | $1,364 +1.4% | $108,039 +2% |
| 2022 | $1,345 +2% | $105,922 +2% |
| 2021 | $1,318 +0.7% | $103,846 +1% |
| 2020 | $1,309 +1.7% | $102,782 +2% |
| 2019 | $1,288 +2.7% | $100,768 +2% |
| 2018 | $1,254 +11.6% | $98,794 +2% |
| 2017 | $1,124 -4.3% | $96,857 +2% |
| 2016 | $1,175 -1% | $94,959 +1.5% |
| 2015 | $1,187 | $93,534 +2% |
| 2014 | $1,187 | $91,703 +0.5% |
| 2013 | -- | $91,290 +2% |
| 2012 | -- | $89,500 -42% |
| 2011 | -- | $154,359 -8% |
| 2010 | -- | $167,781 -17.7% |
| 2008 | -- | $203,983 +2% |
| 2007 | -- | $199,985 +2% |
| 2006 | -- | $196,065 +2% |
| 2005 | -- | $192,221 +2% |
| 2004 | -- | $188,453 +16.3% |
| 2003 | -- | $162,000 +87.9% |
| 2002 | -- | $86,222 +2% |
| 2001 | -- | $84,532 +2% |
| 2000 | -- | $82,875 |
Find assessor info on the county website
Monthly payment
Estimated monthly payment$1,822
All calculations are estimates and provided by Zillow, Inc. for informational purposes only. Actual amounts may vary.
HOA fees may include property taxes on listings classified as Co-Ops. Contact the listing agent and/or owner for fee details.
Mortgage interest rates are dependent on a number of factors, including credit score, down payment, and repayment length. Interest rate data provided by Zillow Group Marketplace, Inc. as of 1/1/1970 from various mortgage lenders with which we have lead or other similar arrangements; the Estimated Payment is an average of those rates.
See how much you could borrow to make a competitive offer.
Climate risks
Neighborhood: Mills Ranch
Nearby schools
GreatSchools rating
- 7/10Peter J. Shields Elementary SchoolGrades: K-5Distance: 0.5 mi
- 4/10W. E. Mitchell Middle SchoolGrades: 6-8Distance: 0.9 mi
- 4/10Cordova High SchoolGrades: 9-12Distance: 0.9 mi


- California
- Sacramento County
- Rancho Cordova
- 95670
- Mills Ranch
- 2108 Pantages Cir
Nearby cities
Nearby neighborhoods
Nearby zip codes
Other Rancho Cordova Topics
