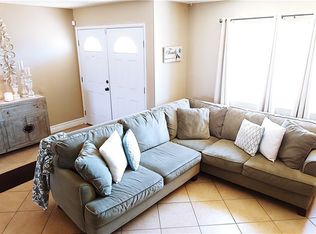
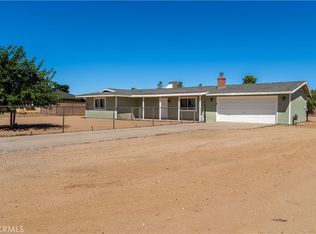
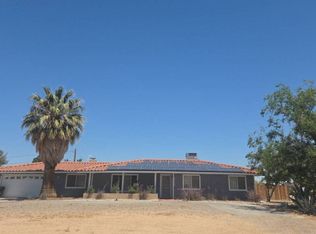
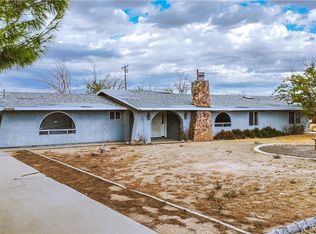
This 1924 square foot single family home has 3 bedrooms and 3.0 bathrooms. This home is located at 21220 Balsa St, Apple Valley, CA 92308.
Pre-foreclosure
Est. $451,300
21220 Balsa St, Apple Valley, CA 92308
3beds
1,924sqft
SingleFamily
Built in 1980
0.43 Acres Lot
$451,300 Zestimate®
$235/sqft
$-- HOA
Overview
- 62 days |
- 6 |
- 0 |
Facts & features
Interior
Bedrooms & bathrooms
- Bedrooms: 3
- Bathrooms: 3
- Full bathrooms: 3
Heating
- Other
Cooling
- Central
Appliances
- Included: Dishwasher
- Laundry: In Garage, Gas & Electric Dryer Hookup
Features
- Has fireplace: Yes
- Common walls with other units/homes: No Common Walls
Interior area
- Total interior livable area: 1,924 sqft
Property
Parking
- Total spaces: 2
- Parking features: Garage - Attached
Features
- Levels: One
- Has view: Yes
- View description: Territorial
Lot
- Size: 0.43 Acres
- Features: Back Yard, Front Yard, Level with Street, Lot 10000-19999 Sqft
Details
- Parcel number: 0434223130000
- Special conditions: Standard
Construction
Type & style
- Home type: SingleFamily
Materials
- wood frame
- Roof: Other
Condition
- Year built: 1980
Utilities & green energy
- Sewer: Conventional Septic
- Water: Public
Community & HOA
Location
- Region: Apple Valley
Financial & listing details
- Price per square foot: $235/sqft
- Tax assessed value: $435,095
- Annual tax amount: $6,504
Visit our professional directory to find a foreclosure specialist in your area that can help with your home search.
Find a foreclosure agentForeclosure details
Estimated market value
$451,300
$429,000 - $474,000
$2,550/mo
Price history
| Date | Event | Price |
|---|---|---|
| 4/8/2022 | Sold | $410,000+2.5%$213/sqft |
Source: Public Record Report a problem | ||
| 3/9/2022 | Pending sale | $399,999$208/sqft |
Source: | ||
| 3/4/2022 | Listed for sale | $399,999$208/sqft |
Source: | ||
| 3/4/2022 | Contingent | $399,999$208/sqft |
Source: | ||
| 2/11/2022 | Pending sale | $399,999$208/sqft |
Source: | ||
| 1/30/2022 | Listed for sale | $399,999+42.9%$208/sqft |
Source: | ||
| 11/16/2021 | Sold | $280,000+33.3%$146/sqft |
Source: Public Record Report a problem | ||
| 2/19/2016 | Listing removed | $210,000$109/sqft |
Source: CENTURY 21 Town & Country #EV15036685 Report a problem | ||
| 2/26/2015 | Listed for sale | $210,000-2.3%$109/sqft |
Source: CENTURY 21 Town & Country #EV15036685 Report a problem | ||
| 8/30/2014 | Listing removed | $215,000$112/sqft |
Source: CENTURY 21 Town & Country #EV14163401 Report a problem | ||
| 8/4/2014 | Listed for sale | $215,000+95.5%$112/sqft |
Source: Century 21 Town & Country #EV14163401 Report a problem | ||
| 7/1/2010 | Sold | $110,000+10.1%$57/sqft |
Source: Public Record Report a problem | ||
| 4/11/2010 | Price change | $99,900+0.4%$52/sqft |
Source: JAMES DE SPAIN #117508366 Report a problem | ||
| 4/4/2010 | Listed for sale | $99,500$52/sqft |
Source: JAMES DE SPAIN #117508366 Report a problem | ||
Public tax history
| Year | Property taxes | Tax assessment |
|---|---|---|
| 2025 | $6,504 +24.4% | $435,095 +2% |
| 2024 | $5,228 -6.6% | $426,564 +2% |
| 2023 | $5,598 +69.2% | $418,200 +49.4% |
| 2022 | $3,308 +116.7% | $280,000 +115.1% |
| 2021 | $1,527 -11% | $130,197 +1% |
| 2020 | $1,715 +16% | $128,862 +2% |
| 2019 | $1,478 +2.6% | $126,336 +2% |
| 2018 | $1,440 +1.5% | $123,859 +2% |
| 2017 | $1,419 | $121,431 +2% |
| 2016 | $1,419 +6.2% | $119,050 +1.5% |
| 2015 | $1,335 +1.6% | $117,261 +2% |
| 2014 | $1,314 | $114,964 +0.5% |
| 2013 | -- | $114,444 +2% |
| 2012 | -- | $112,200 +2% |
| 2011 | -- | $110,000 +6.9% |
| 2010 | -- | $102,921 -0.2% |
| 2009 | -- | $103,165 +2% |
| 2008 | -- | $101,142 +2% |
| 2007 | -- | $99,159 +2% |
| 2006 | -- | $97,215 +2% |
| 2005 | -- | $95,309 +2% |
| 2004 | -- | $93,440 +1.9% |
| 2003 | -- | $91,728 +2% |
| 2002 | -- | $89,929 +2% |
| 2001 | -- | $88,166 +2% |
| 2000 | -- | $86,437 |
Find assessor info on the county website
Monthly payment
Estimated monthly payment$1,822
All calculations are estimates and provided by Zillow, Inc. for informational purposes only. Actual amounts may vary.
HOA fees may include property taxes on listings classified as Co-Ops. Contact the listing agent and/or owner for fee details.
Mortgage interest rates are dependent on a number of factors, including credit score, down payment, and repayment length. Interest rate data provided by Zillow Group Marketplace, Inc. as of 1/1/1970 from various mortgage lenders with which we have lead or other similar arrangements; the Estimated Payment is an average of those rates.
See how much you could borrow to make a competitive offer.
Climate risks
Neighborhood: 92308
Nearby schools
GreatSchools rating
- 1/10Mariana AcademyGrades: K-8Distance: 0.8 mi
- 5/10Apple Valley High SchoolGrades: 9-12Distance: 1.7 mi
Schools provided by the listing agent
- District: Apply Valley Unified
Source: The MLS. This data may not be complete. We recommend contacting the local school district to confirm school assignments for this home.


- California
- San Bernardino County
- Apple Valley
- 92308
- 21220 Balsa St
Nearby cities
Nearby zip codes
Other Apple Valley Topics
