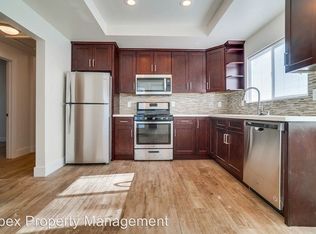
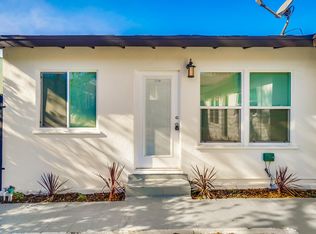
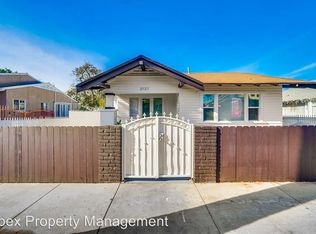
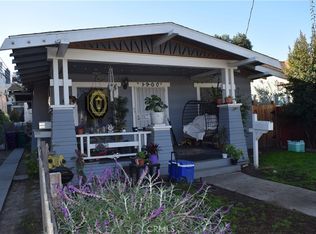
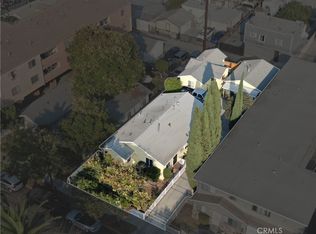
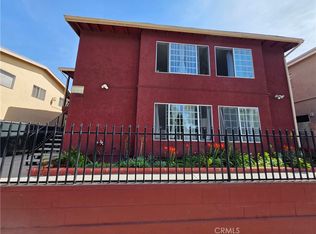
We are pleased to present a 4-unit multifamily property. Built in 1928 originally as a triplex, the subject property consists of 2,351 rentable square feet spread throughout a 6,258 square foot lot. The property consists of a Two Bedroom + Den / One Bathroom House with 2 Existing One Bedroom / One Bathroom Units and 1 Brand new One Bedroom ADU. It contains three garages and one storage space.
For sale
Listed by: Marcus & Millichap • Kevin King • Contact: 562-257-1200
Price cut: $20K (6/4)
$975,000
2129 Locust Ave, Long Beach, CA 90806
5beds
4baths
2,351sqft
Multi Family
Built in 1928
-- sqft lot
$958,500 Zestimate®
$415/sqft
$-- HOA
What's special
Three garages
- 92 days |
- 194 |
- 2 |
Zillow last checked:
Listing updated:
Listed by:
Kevin King DRE #01158184 kking@marcusmillichap.com,
Marcus & Millichap
Source: CRMLS,MLS#: PW26071898 Originating MLS: California Regional MLS
Loading...
Facts & features
Interior
Bedrooms & bathrooms
- Bedrooms: 5
- Bathrooms: 4
Appliances
- Laundry: None
Features
- Common walls with other units/homes: 1 Common Wall
Interior area
- Total structure area: 2,351
- Total interior livable area: 2,351 sqft
Property
Parking
- Total spaces: 3
- Parking features: Garage
- Garage spaces: 3
Features
- Entry location: Front
- Pool features: None
Lot
- Size: 6,258 Square Feet
- Features: 2-5 Units/Acre
Details
- Parcel number: 7208025021
- Special conditions: Standard
Construction
Type & style
- Home type: MultiFamily
- Property subtype: Multi Family
- Attached to another structure: Yes
Condition
- New construction: No
- Year built: 1928
Utilities & green energy
- Sewer: Public Sewer, Septic Type Unknown
- Water: Public
Community & HOA
Community
- Features: Curbs, Sidewalks
- Subdivision: Wrigley Area (Wr)
Location
- Region: Long Beach
Financial & listing details
- Price per square foot: $415/sqft
- Tax assessed value: $373,433
- Annual tax amount: $5,547
- Date on market: 4/3/2026
- Cumulative days on market: 93 days
- Listing terms: Cash,Cash to New Loan,1031 Exchange
Estimated market value
$958,500
$911,000 - $1.01M
$2,679/mo
Price history
| Date | Event | Price |
|---|---|---|
| 6/4/2026 | Price change | $975,000-2%$415/sqft |
Source: | ||
| 4/3/2026 | Listed for sale | $995,000+243.1%$423/sqft |
Source: | ||
| 4/29/2009 | Sold | $290,000-3.3%$123/sqft |
Source: Public Record Report a problem | ||
| 2/22/2009 | Listed for sale | $299,900+12%$128/sqft |
Source: Listhub #S564566 Report a problem | ||
| 1/22/2009 | Sold | $267,750-46.4%$114/sqft |
Source: Public Record Report a problem | ||
| 9/28/2008 | Price change | $499,900-9.1%$213/sqft |
Source: Listhub #P647584 Report a problem | ||
| 8/23/2008 | Listed for sale | $549,900+202.3%$234/sqft |
Source: Listhub #P647584 Report a problem | ||
| 12/27/2000 | Sold | $181,900+109.1%$77/sqft |
Source: Public Record Report a problem | ||
| 9/13/1996 | Sold | $87,000-31%$37/sqft |
Source: Public Record Report a problem | ||
| 2/29/1996 | Sold | $126,000$54/sqft |
Source: Public Record Report a problem | ||
Public tax history
| Year | Property taxes | Tax assessment |
|---|---|---|
| 2025 | $5,547 +4.3% | $373,433 +2% |
| 2024 | $5,316 +4.1% | $366,112 +2% |
| 2023 | $5,104 +6.2% | $358,934 +2% |
| 2022 | $4,804 +2.3% | $351,897 +2% |
| 2021 | $4,698 +0.3% | $344,998 +1% |
| 2020 | $4,686 | $341,462 +2% |
| 2019 | $4,686 +5.4% | $334,767 +2% |
| 2018 | $4,447 | $328,204 +2% |
| 2017 | $4,447 +1.1% | $321,770 +2% |
| 2016 | $4,400 +7.5% | $315,462 +1.5% |
| 2015 | $4,093 +4.3% | $310,725 +2% |
| 2014 | $3,922 | $304,639 +4.5% |
| 2011 | -- | $291,489 +0.8% |
| 2010 | -- | $289,312 +36.6% |
| 2009 | -- | $211,787 +2% |
| 2008 | -- | $207,636 +2% |
| 2007 | -- | $203,565 +2% |
| 2006 | -- | $199,575 |
| 2005 | -- | $199,575 +4% |
| 2004 | -- | $191,827 +1.9% |
| 2003 | -- | $188,312 +104.3% |
| 2000 | -- | $92,190 |
Find assessor info on the county website
Monthly payment
Est. payment$--/mo
Payment breakdown
Explore the cost of this home by adjusting the details. Changes won't be saved.All calculations are estimates and provided by Zillow, Inc. for informational purposes only. Actual amounts may vary.
HOA fees may include property taxes on listings classified as Co-Ops. Contact the listing agent and/or owner for fee details.
Mortgage interest rates are dependent on a number of factors, including credit score, down payment, and repayment length. Interest rate data provided by Zillow Group Marketplace, Inc. as of 1/1/1970 from various mortgage lenders with which we have lead or other similar arrangements; the Estimated Payment is an average of those rates.
See how much you could borrow to make a competitive offer.
Climate risks
Neighborhood: Wrigley
Nearby schools
GreatSchools rating
- 5/10Robinson AcademyGrades: K-8Distance: 1 mi
- 7/10Polytechnic High SchoolGrades: 9-12Distance: 0.7 mi
A local agent can set up tours, give advice and negotiate with sellers.

Local buyer's agents are ready to help
- California
- Los Angeles County
- Long Beach
- 90806
- Wrigley
- 2129 Locust Ave
Nearby cities
Nearby neighborhoods
Nearby zip codes
Other Long Beach Topics
