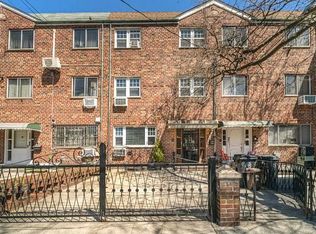
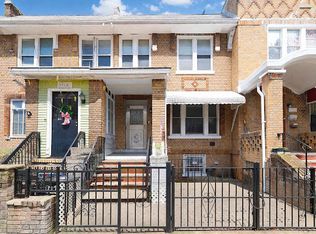
Beautifully maintained detached brick 2-family home located on a quiet residential block in the heart of Gravesend. This spacious property offers 6 bedrooms and 3 full bathrooms, providing flexibility for end-users, investors, or multi-generational living. Features include a private driveway with garage, updated plumbing and electric, and a full finished basement offering additional storage space. Interior highlights include granite kitchen countertops, hardwood floors, and ceramic tile flooring in the basement. Enjoy both a front and back yard, perfect for outdoor use and seasonal enjoyment. Ideally situated just off Avenue U, close to shopping, restaurants, schools, houses of worship, and public transportation. A rare opportunity to own a solid brick home in a prime Brooklyn location.
Active
Price cut: $46K (5/19)
$1,349,000
2149 W 9th St, Brooklyn, NY 11223
4beds
1,815sqft
Multi Family
Built in 1930
-- sqft lot
$1,306,300 Zestimate®
$743/sqft
$-- HOA
What's special
Solid brick homeHardwood floorsPrivate driveway with garageGranite kitchen countertops
- 80 days |
- 1,069 |
- 27 |
Zillow last checked:
Listing updated:
Listed by:
Remax Real Estate Professionals 718-887-5708,
Vito Angelo,
Billy Apter
Source: StreetEasy,MLS#: S1822090
Loading...
Facts & features
Interior
Bedrooms & bathrooms
- Bedrooms: 4
- Bathrooms: 3
- Full bathrooms: 3
Features
- Flooring: Hardwood
- Has fireplace: No
Interior area
- Total structure area: 1,815
- Total interior livable area: 1,815 sqft
Property
Parking
- Parking features: Garage
- Has garage: Yes
Features
- Patio & porch: Other
- Exterior features: Courtyard, Garden
- Has view: Yes
- View description: City
Details
- Parcel number: 071180058
- Special conditions: Resale
Construction
Type & style
- Home type: MultiFamily
- Property subtype: Multi Family
Condition
- Year built: 1930
Community & HOA
Community
- Subdivision: Gravesend
Location
- Region: Brooklyn
Financial & listing details
- Price per square foot: $743/sqft
- Tax assessed value: $966,000
- Annual tax amount: $8,190
- Date on market: 4/15/2026
Estimated market value
$1,306,300
$1.24M - $1.37M
$3,093/mo
Price history
| Date | Event | Price |
|---|---|---|
| 5/19/2026 | Price change | $1,349,000-3.3%$743/sqft |
Source: | ||
| 4/15/2026 | Listed for sale | $1,395,000+9%$769/sqft |
Source: | ||
| 6/11/2019 | Listing removed | $1,280,000$705/sqft |
Source: Fillmore Real Estate #194012 Report a problem | ||
| 10/5/2018 | Price change | $1,280,000-5.1%$705/sqft |
Source: Fillmore Real Estate #840044 Report a problem | ||
| 10/4/2017 | Price change | $1,349,000-3.6%$743/sqft |
Source: EXIT REALTY TODAY #411796 Report a problem | ||
| 6/29/2017 | Listed for sale | $1,400,000+75.2%$771/sqft |
Source: EXIT REALTY TODAY #411796 Report a problem | ||
| 9/2/2014 | Listing removed | $799,000$440/sqft |
Source: Re/max At The Slope #384075 Report a problem | ||
| 3/8/2014 | Listed for sale | $799,000$440/sqft |
Source: RE/MAX At The Slope #384075 Report a problem | ||
Public tax history
| Year | Property taxes | Tax assessment |
|---|---|---|
| 2025 | $8,190 +0.9% | $57,960 -7.9% |
| 2024 | $8,117 | $62,940 -17.6% |
| 2023 | -- | $76,380 -8.7% |
| 2022 | -- | $83,700 +9.7% |
| 2021 | -- | $76,320 +19.7% |
| 2020 | $2,981 +2.6% | $63,780 +25.8% |
| 2019 | $2,905 -56.4% | $50,700 +59% |
| 2018 | $6,670 +8.7% | $31,886 +5.9% |
| 2017 | $6,135 +145.5% | $30,097 +5% |
| 2016 | $2,499 | $28,663 |
| 2015 | $2,499 +67.5% | $28,663 +2.1% |
| 2014 | $1,492 | $28,066 +5.6% |
| 2013 | -- | $26,572 +5.9% |
| 2012 | -- | $25,081 +5% |
| 2011 | -- | $23,886 |
| 2010 | -- | $23,886 +2.1% |
| 2009 | -- | $23,389 +5.6% |
| 2008 | -- | $22,144 +5.9% |
| 2007 | -- | $20,901 +5% |
| 2006 | -- | $19,905 |
| 2005 | -- | $19,905 +2.1% |
| 2004 | -- | $19,491 +5.6% |
| 2003 | -- | $18,454 +5.9% |
| 2002 | -- | $17,418 +5% |
| 2001 | -- | $16,588 |
| 2000 | -- | $16,588 |
Find assessor info on the county website
Monthly payment
Estimated monthly payment$1,822
All calculations are estimates and provided by Zillow, Inc. for informational purposes only. Actual amounts may vary.
HOA fees may include property taxes on listings classified as Co-Ops. Contact the listing agent and/or owner for fee details.
Mortgage interest rates are dependent on a number of factors, including credit score, down payment, and repayment length. Interest rate data provided by Zillow Group Marketplace, Inc. as of 1/1/1970 from various mortgage lenders with which we have lead or other similar arrangements; the Estimated Payment is an average of those rates.
See how much you could borrow to make a competitive offer.
Climate risks
Neighborhood: Gravesend
Nearby schools
GreatSchools rating
- 7/10Ps 95 The GravesendGrades: K-8Distance: 0.3 mi
- 2/10High School Of Sports ManagementGrades: 9-12Distance: 0.3 mi
- 8/10Is 228 David A BoodyGrades: 6-8Distance: 0.4 mi

A local agent can set up tours, give advice and negotiate with sellers.


Nearby cities
Nearby neighborhoods
Nearby zip codes
Other New York Topics
