Six blocks to Metro Rail!!! You must see this neighborhood, street and home! Best value available!
Great location to get to Miami work areas. Interior updated and ready to move in.
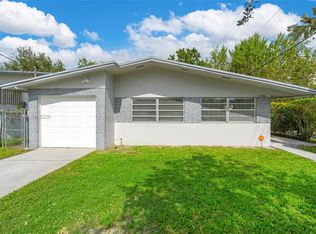
Exterior just painted. Two full baths with tubs & showers, large laundry room and closets. Hot street.
Pre-foreclosure
Est. $397,600
2157 NW 48th St, Miami, FL 33142
4beds
1,176sqft
SingleFamily
Built in 1972
4,356 Square Feet Lot
$397,600 Zestimate®
$338/sqft
$-- HOA
Overview
- 51 days
- 31
- 0
Facts & features
Interior
Bedrooms & bathrooms
- Bedrooms: 4
- Bathrooms: 2
- Full bathrooms: 2
Appliances
- Included: Dishwasher, Range / Oven, Refrigerator, Washer
Features
- Flooring: Other, Laminate, Linoleum / Vinyl
- Basement: None
- Has fireplace: No
Interior area
- Total interior livable area: 1,176 sqft
Property
Parking
- Total spaces: 1
- Parking features: Off-street
Features
- Exterior features: Stucco
Lot
- Size: 4,356 Square Feet
Details
- Parcel number: 3031220260470
Construction
Type & style
- Home type: SingleFamily
Materials
- concrete
- Roof: Asphalt
Condition
- Year built: 1972
Community & HOA
Location
- Region: Miami
Financial & listing details
- Price per square foot: $338/sqft
- Tax assessed value: $260,553
- Annual tax amount: $2,245
Foreclosure details
Estimated market value
$397,600
$362,000 - $429,000
$3,258/mo
Price history
| Date | Event | Price |
|---|---|---|
| 3/24/2021 | Listing removed | -- |
Source: Owner Report a problem | ||
| 4/12/2018 | Sold | $172,000-1.7%$146/sqft |
Source: Public Record Report a problem | ||
| 11/27/2017 | Price change | $175,000+6.1%$149/sqft |
Source: Owner Report a problem | ||
| 11/15/2017 | Price change | $165,000+3.2%$140/sqft |
Source: Owner Report a problem | ||
| 11/3/2017 | Price change | $159,900-3.7%$136/sqft |
Source: Owner Report a problem | ||
| 11/1/2017 | Price change | $166,000-0.9%$141/sqft |
Source: Owner Report a problem | ||
| 10/27/2017 | Price change | $167,500-0.9%$142/sqft |
Source: Owner Report a problem | ||
| 10/21/2017 | Price change | $169,000+9%$144/sqft |
Source: Owner Report a problem | ||
| 10/18/2017 | Listed for sale | $155,000+14.8%$132/sqft |
Source: Owner Report a problem | ||
| 8/21/2007 | Sold | $135,000-25%$115/sqft |
Source: Public Record Report a problem | ||
| 1/24/2006 | Sold | $180,000$153/sqft |
Source: Public Record Report a problem | ||
Public tax history
| Year | Property taxes | Tax assessment |
|---|---|---|
| 2025 | $2,245 +2.7% | $131,012 +2.9% |
| 2024 | $2,185 +10.1% | $127,320 +3% |
| 2023 | $1,985 +5.3% | $123,612 +3% |
| 2022 | $1,886 +2% | $120,012 +3% |
| 2021 | $1,849 +1.2% | $116,517 +1.4% |
| 2020 | $1,827 +2.4% | $114,909 +2.3% |
| 2019 | $1,785 -1.5% | $112,326 +78.9% |
| 2018 | $1,813 | $62,784 +10% |
| 2017 | $1,813 +11% | $57,077 +10% |
| 2016 | $1,633 +24.2% | $51,889 +10% |
| 2015 | $1,315 +4.2% | $47,172 +9.3% |
| 2014 | $1,262 +6.8% | $43,142 +6.4% |
| 2013 | $1,181 | $40,564 +4.8% |
| 2012 | $1,181 -4.1% | $38,696 -6.5% |
| 2011 | $1,231 -31.5% | $41,393 -37.3% |
| 2010 | $1,799 -30.9% | $65,975 -42.1% |
| 2009 | $2,602 -13.1% | $113,873 -16.7% |
| 2007 | $2,992 +276.2% | $136,747 |
| 2006 | $795 | -- |
| 2005 | $795 +2.8% | -- |
| 2004 | $774 +12.2% | -- |
| 2003 | $690 +5.4% | -- |
| 2002 | $654 | -- |
| 2001 | $654 | -- |
Find assessor info on the county website
Monthly payment
Climate risks
Neighborhood: 33142

Similar homes
- $405,0003 bd2 ba1.2k sqftSunny Slope Pk, Miami, FL 33142For Sale

 MLS ID #A12082037, Marvin Lara, Trust Real Estate Research Center Inc. MIAMI
- $430,0003 bd1 ba1.3k sqftCauseway Park, Miami, FL 33142For Sale
 MLS ID #A12123436, Jada Jean Louis, Lifestyle International Realty. MIAMI
- $399,0004 bd2 ba1.4k sqftFairhaven Gardens, Miami, FL 33142For Sale
 MLS ID #A12125545, Alejandro Bespalko, Bagroup Realty. MIAMI
- $469,0003 bd1 ba1.1k sqftGreen Close, Miami, FL 33142For Sale
 MLS ID #A12125433, Giovanni Bertolotti, Fausto Commercial Realty Consultants Inc. MIAMI
- $409,9004 bd2 ba1.2k sqft1850 NW 35th Street, Miami, FL 33142For Sale
 MLS ID #B26040838, Frederic Achotegui, AZUR Realty, LLC. BeachesMLS
- $525,0003 bd2 ba1k sqftFloral Pk, Miami, FL 33142For SaleMLS ID #A12121922, Mickael Jarrige PA, Charles Rutenberg Realty FTL. MIAMI
- $350,0003 bd1 ba868 sqftEarlington Heights, Miami, FL 33142For SaleMLS ID #A12028126, Alina Del Portal, Capital Homes Inc. MIAMI
- $504,0003 bd2 ba1.1k sqftSunny Slope Pk, Miami, FL 33142For SaleMLS ID #A12113069, Adrienne Stephens Walks, Lifestyle International Realty. MIAMI
- $435,0003 bd1 ba1.2k sqftRoosevelt Park, Miami, FL 33142For SaleMLS ID #A12062921, Katy Gomes Dos Santos, Avanti Way Realty LLC. MIAMI
- $460,0003 bd1 ba1.2k sqftGlenhaven, Miami, FL 33142For SaleMLS ID #A12124958, Jose Rodriguez, South Florida Realty LLC. MIAMI
- $440,0002 bd1 ba946 sqftFloral Park Rev Plat, Miami, FL 33142For SaleMLS ID #A12093203, Stephen Eaton, Eaton Real Estate Company LLC. MIAMI
- $295,0003 bd1 ba1.1k sqft1899 NW 53RD Street, Miami, FL 33142For SaleMLS ID #B26100339, Robert Baker, VantaSure Realty LLC. BeachesMLS
- $485,0003 bd1 ba968 sqftMonnah Park, Miami, FL 33142For SaleMLS ID #A12109417, Catuska Fernandez, ACE Florida Realty, LLC. MIAMI
- $525,0004 bd2 ba1.5k sqft1420 NW 51st Terrace, Miami, FL 33142For SaleMLS ID #B26099122, Eric Katz, Thank You Realty LLC. BeachesMLS
- $450,0003 bd2 ba1.4k sqftHolleman Manor Addn, Miami, FL 33142For SaleMLS ID #A12106131, Gregory Celentano, Union Street Partners, LLC. MIAMI
- $389,9994 bd2 ba1.4k sqftPara Villa Heights, Miami, FL 33147For SaleMLS ID #A12040202, Luigui Ferrer, Smart Miami Realty, LLC.. MIAMI
- $485,0003 bd2 ba1.5k sqft1772 NW 45th Street, Miami, FL 33142For SaleMLS ID #B26095520, Patrick C Samuels, All Points Rlty & Investments. BeachesMLS
- $539,9004 bd2 ba1.1k sqftGlenwood Heights Addn, Miami, FL 33142For SaleMLS ID #A12108312, Stephanie Chaparro, Luxe Properties. MIAMI
- $400,0004 bd2 ba1.3k sqftLiberty City, Miami, FL 33147For SaleMLS ID #A12089309, Lucila Ursztein, BM2 Realty. MIAMI
- $535,0004 bd2 ba1.5k sqftGlenwood Hgts, Miami, FL 33142For SaleMLS ID #A12116816, Cristina Negru, Compass Florida, LLC. MIAMI
