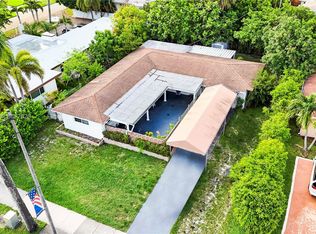
3 bedroom, 2 bathroom house with spacious fenced yard in Lawn Acres. Outside utility room, carport, convenient to I-95 and Turnpike.
For sale
$509,900
217 S 57th Ter, Hollywood, FL 33023
3beds
1,512sqft
Single Family Residence
Built in 1955
8,255 Square Feet Lot
$508,200 Zestimate®
$337/sqft
$-- HOA
What's special
Spacious fenced yardOutside utility room
- 8 days
- 524
- 56
Zillow last checked:
Listing updated:
Listed by:
Laura Hilton PA 407-718-2291,
Charles Rutenberg Realty Orlan
Source: MIAMI,MLS#: A12106992 Originating MLS: A-Miami Association of REALTORS
Facts & features
Interior
Bedrooms & bathrooms
- Bedrooms: 3
- Bathrooms: 2
- Full bathrooms: 2
Heating
- Central
Cooling
- Central Air
Features
- Other
- Flooring: Terrazzo, Tile
Interior area
- Total structure area: 2,153
- Total interior livable area: 1,512 sqft
Video & virtual tour
Property
Parking
- Total spaces: 2
- Parking features: Covered
- Carport spaces: 2
Features
- Stories: 1
- Pool features: R30-No Pool/No Water
- Fencing: Fenced
- View description: None
Lot
- Size: 8,255 Square Feet
- Features: Less Than 1/4 Acre Lot
Details
- Parcel number: 514113231020
- Zoning: RS-5
- Other equipment: None
Construction
Type & style
- Home type: SingleFamily
- Property subtype: Single Family Residence
Materials
- Other
- Roof: Other
Condition
- Year built: 1955
Utilities & green energy
- Sewer: Public Sewer
- Water: Municipal Water
Community & HOA
Community
- Features: None, No Subdiv/Park Info
- Subdivision: Lawn Acres
HOA
- Has HOA: No
Location
- Region: Hollywood
Financial & listing details
- Price per square foot: $337/sqft
- Tax assessed value: $500,550
- Annual tax amount: $14,812
- Date on market: 10/13/2026
- Listing terms: All Cash,Conventional
Estimated market value
$508,200
$483,000 - $534,000
$2,984/mo
Price history
| Date | Event | Price |
|---|---|---|
| 10/15/2026 | Listed for sale | $509,900+19.9%$337/sqft |
Source:  MIAMI #A12106992 Report a problem | ||
| 2/26/2026 | Sold | $425,100-24.1%$281/sqft |
Source: Public Record Report a problem | ||
| 12/26/2025 | Price change | $560,000-3.4%$370/sqft |
Source: MIAMI #A11869677 Report a problem | ||
| 12/19/2025 | Price change | $580,000-2.5%$384/sqft |
Source: MIAMI #A11869677 Report a problem | ||
| 12/3/2025 | Price change | $595,000-4%$394/sqft |
Source: MIAMI #A11869677 Report a problem | ||
| 10/15/2025 | Price change | $620,000-1.6%$410/sqft |
Source: MIAMI #A11869677 Report a problem | ||
| 9/1/2025 | Listed for sale | $630,000+10.7%$417/sqft |
Source: MIAMI #A11869677 Report a problem | ||
| 8/1/2025 | Listing removed | $568,900$376/sqft |
Source:  BeachesMLS #F10483942 Report a problem | ||
| 1/31/2025 | Listed for sale | $568,900-0.2%$376/sqft |
Source: BeachesMLS #F10483942 Report a problem | ||
| 12/13/2024 | Listing removed | $569,999-1.7%$377/sqft |
Source: BeachesMLS #F10460121 Report a problem | ||
| 10/28/2024 | Price change | $579,999-3.3%$384/sqft |
Source: BeachesMLS #F10460121 Report a problem | ||
| 10/3/2024 | Price change | $599,990-3.2%$397/sqft |
Source: BeachesMLS #F10460121 Report a problem | ||
| 9/6/2024 | Listed for sale | $619,990-7.3%$410/sqft |
Source: BeachesMLS #F10460121 Report a problem | ||
| 6/29/2024 | Listing removed | $669,000-4.4%$442/sqft |
Source: MIAMI #A11524448 Report a problem | ||
| 5/8/2024 | Listing removed | -- |
Source: MIAMI #A11524448 Report a problem | ||
| 1/31/2024 | Listed for sale | $700,000-2.1%$463/sqft |
Source: MIAMI #A11524448 Report a problem | ||
| 1/18/2024 | Listing removed | -- |
Source: MIAMI #A11420831 Report a problem | ||
| 9/8/2023 | Listing removed | $715,000+5.1%$473/sqft |
Source: MIAMI #A11420831 Report a problem | ||
| 8/11/2023 | Price change | $680,000-3.5%$450/sqft |
Source: MIAMI #A11420831 Report a problem | ||
| 7/19/2023 | Listed for sale | $705,000+0.9%$466/sqft |
Source: MIAMI #A11420831 Report a problem | ||
| 1/1/2023 | Listing removed | -- |
Source: MIAMI #A11276290 Report a problem | ||
| 10/12/2022 | Price change | $699,000-5.5%$462/sqft |
Source: MIAMI #A11276290 Report a problem | ||
| 9/21/2022 | Listed for sale | $739,900+138.7%$489/sqft |
Source: MIAMI #A11276290 Report a problem | ||
| 5/9/2007 | Sold | $310,000+122.2%$205/sqft |
Source: Public Record Report a problem | ||
| 4/25/2001 | Sold | $139,500+19.2%$92/sqft |
Source: Public Record Report a problem | ||
| 2/17/1999 | Sold | $117,000-2.1%$77/sqft |
Source: Public Record Report a problem | ||
| 3/27/1998 | Sold | $119,500+61.2%$79/sqft |
Source: Public Record Report a problem | ||
| 4/1/1992 | Sold | $74,143$49/sqft |
Source: Public Record Report a problem | ||
Public tax history
| Year | Property taxes | Tax assessment |
|---|---|---|
| 2025 | $14,812 +5.6% | $436,500 +10% |
| 2024 | $14,030 +3.6% | $396,820 +10% |
| 2023 | $13,546 +10.6% | $360,750 +10% |
| 2022 | $12,251 +8.1% | $327,960 +10% |
| 2021 | $11,328 +3% | $298,150 +5.8% |
| 2020 | $10,992 +56.3% | $281,740 +110.5% |
| 2019 | $7,032 | $133,830 +1.9% |
| 2018 | $7,032 +31.5% | $131,340 +2.1% |
| 2017 | $5,348 +163.7% | $128,640 +2.1% |
| 2016 | $2,028 +0.6% | $126,000 +0.7% |
| 2015 | $2,015 -0.7% | $125,130 +0.8% |
| 2014 | $2,030 | $124,140 -14.4% |
| 2013 | $2,030 +4.5% | $145,010 +11% |
| 2012 | $1,943 +4.6% | $130,690 -10.7% |
| 2011 | $1,857 +2.9% | $146,320 +28.3% |
| 2010 | $1,804 -46% | $114,010 -39.8% |
| 2009 | $3,341 -21.8% | $189,290 -21.3% |
| 2008 | $4,271 -18% | $240,380 -0.7% |
| 2007 | $5,211 -7.4% | $242,130 +2.9% |
| 2006 | $5,625 | $235,310 +20.6% |
| 2005 | -- | $195,060 +30.5% |
| 2004 | $3,822 +14.1% | $149,490 +16.6% |
| 2003 | $3,348 +7% | $128,240 +8.7% |
| 2002 | $3,129 +70% | $118,010 +25.9% |
| 2001 | $1,841 +5.6% | $93,750 |
| 2000 | $1,743 | -- |
Find assessor info on the county website
Monthly payment
Est. payment
Payment breakdown
Explore the cost of this home by adjusting the details. Changes won't be saved.Climate risks
Neighborhood: Lawnacres
Nearby schools
Schools provided by the listing agent
- Elementary: Orange Brook
- Middle: Olsen
- High: South Broward
Source: MIAMI. This data may not be complete. We recommend contacting the local school district to confirm school assignments for this home.

Similar homes
- $525,0003 bd3 ba1.8k sqftOrangebrook Golf Estates, Hollywood, FL 33021For Sale
 MLS ID #A12111712, Roberto Serrano, Lifestyle International Realty. MIAMI
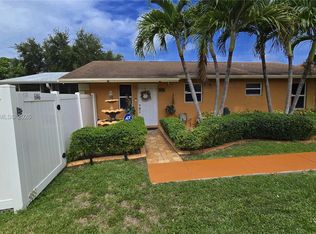
- $560,0003 bd2 ba1.5k sqftSouth Broward Ranches No, Pembroke Pines, FL 33023For Sale
 MLS ID #A12074358, Jose Rodriguez, LPT Realty, LLC. MIAMI
- $540,0003 bd3 ba1.6k sqft2420 N 59TH Terrace, Hollywood, FL 33021For Sale

 MLS ID #B26078837, Janet M DeL'Etoile, Allstar Realty Inc. BeachesMLS
- $560,0003 bd2 ba1.2k sqftMiami Gardens Estates Sec, Hollywood, FL 33023For Sale
 MLS ID #A12069631, Matthew Christian, Trinity Real Estate Group, LLC. MIAMI
- $549,9004 bd3 ba1.3k sqftBoulevard Heights Sec 7, Hollywood, FL 33024For SaleMLS ID #A12068114, Jay Jiggins, Keller Williams Eagle Realty. MIAMI
- $499,9003 bd2 ba1.3k sqftDriftwood Acres No 7, Hollywood, FL 33024For SaleMLS ID #A11796657, Romy Recio, International Realty Group. MIAMI
- $569,9993 bd2 ba1.4k sqftBoulevard Heights Sec 1, Hollywood, FL 33024For SaleMLS ID #A12088552, Lesley Gonzalez Rodriguez, EXP Realty LLC. MIAMI
- $650,0003 bd2 ba1.8k sqft1250 Arthur Street, Hollywood, FL 33019For SaleMLS ID #F10555200, Jean F Charles, NRH Real Estate. BeachesMLS
- $600,0003 bd2 ba1.7k sqftBoulevard Heights Sec 12, Pembroke Pines, FL 33024For SaleMLS ID #A12055307, Ana Vega, Legacy Group Real Estate, LLC.. MIAMI
- $499,0003 bd2 ba1.1k sqftWest Moorland Amd, Dania, FL 33004For SaleMLS ID #A12024333, Gilberto Becerra, Mindful Realty Group. MIAMI
- $635,0003 bd2 ba1.4k sqftLakeview Heights No 2, Hollywood, FL 33021For SaleMLS ID #A11998315, Ricardo Acuna, The Keyes Company. MIAMI
- $545,0003 bd3 ba1.4k sqft9894 NW 2ND Court, Plantation, FL 33324For SaleMLS ID #B26091388, Debra A Giglia, RE/MAX Preferred. BeachesMLS
- $465,0003 bd2 ba1.6k sqftEverglades Sugar & Land C, Pembroke Pines, FL 33026For SaleMLS ID #A12090443, Othoniel Gomez, Deluxe Realty Group Corp. MIAMI
- $458,0003 bd2 ba1.4k sqftCamino, Hollywood, FL 33021For SaleMLS ID #A12084516, Laura Cymring, Beachfront Realty Inc. MIAMI
- $480,0003 bd3 ba1.5k sqft3400 Ivy Way, Miramar, FL 33025For SaleMLS ID #B26040364, David Anthony Fuentes, First World Realty Group,LLC. BeachesMLS
- $559,0003 bd2 ba1.2k sqftRadio Heights, Miami Gardens, FL 33056For SaleMLS ID #A12084705, Patricia Garcia, Equity Real Property and Mgt.. MIAMI
- $575,0003 bd3 ba1.6k sqftTanglewood Townhomes, Hollywood, FL 33025For SaleMLS ID #A12033969, Romina Saaied, Associates Realty. MIAMI
- $599,9994 bd2 ba1.7k sqftWoodhaven Amended Plat, Dania Beach, FL 33004For SaleMLS ID #A11963679, Jose Garcia Jr., Luxury Brand Real Estate LLC. MIAMI
- $680,0003 bd1 ba1.3k sqft1107 S 15th Avenue, Hollywood, FL 33020For SaleMLS ID #B26019842, Gabriella S Urso, Alto Realty Inc. BeachesMLS
- $599,9993 bd2 ba2k sqft2704 CANAL Road, Miramar, FL 33025For SaleMLS ID #B26051825, Cecilia B Lee, United Realty Group Inc.. BeachesMLS
