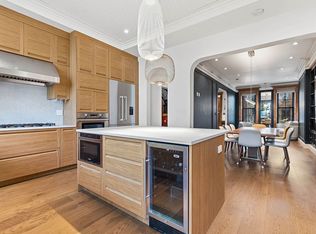
Asset CRG Advisors, LLC, has been exclusively retained to market 22 Patchen Ave, a fully renovated multifamily building located in the Bedford-Stuyvesant neighborhood of Brooklyn.
Property underwent substantial rehabilitation and ownership can provide supporting documentation.
The property consists of approximately 3,600 built square feet and is currently configured with 7 residential units, including six onebedroom apartments and one two-bedroom apartment with a private backyard and a cellar. The building is separately metered for heat and electric and benefits from Protected Tax Class 2B status, limiting future tax increases.
The property is currently vacant and was recently completed, presenting an opportunity for immediate lease-up. Upon full occupancy, the asset is projected to generate approximately $252,000 in gross annual income and $210,635 in net operating income, offering strong cash flow potential for investors seeking a turnkey multifamily asset.
Active
$2,650,000
22 Patchen Ave, Brooklyn, NY 11221
7beds
3,600sqft
Multi Family
Built in 1931
-- sqft lot
$-- Zestimate®
$736/sqft
$-- HOA
What's special
Private backyardOne two-bedroom apartment
- 38 days
- 169
- 4
Zillow last checked:
Listing updated:
Listed by:
Asset CRG Advisors, LLC 646-363-6175,
Sadya Liberow
Source: StreetEasy,MLS#: S1849404
Facts & features
Interior
Bedrooms & bathrooms
- Bedrooms: 7
- Bathrooms: 7
- Full bathrooms: 7
Features
- Has fireplace: No
Interior area
- Total structure area: 3,600
- Total interior livable area: 3,600 sqft
Property
Details
- Parcel number: 016120048
- Special conditions: Resale
Construction
Type & style
- Home type: MultiFamily
- Property subtype: Multi Family
Condition
- Year built: 1931
Community & HOA
Community
- Subdivision: Stuyvesant Heights
Location
- Region: Brooklyn
Financial & listing details
- Price per square foot: $736/sqft
- Tax assessed value: $750,000
- Annual tax amount: $12,709
- Date on market: 9/23/2026
Estimated market value
Not available
Estimated sales range
Not available
$6,029/mo
Price history
| Date | Event | Price |
|---|---|---|
| 9/23/2026 | Listed for sale | $2,650,000+4410.2%$736/sqft |
Source: StreetEasy #S1849404 Report a problem | ||
| 11/10/2025 | Sold | $58,756-53%$16/sqft |
Source: Public Record Report a problem | ||
| 5/7/2025 | Sold | $125,000-89.6%$35/sqft |
Source: Public Record Report a problem | ||
| 11/18/2015 | Sold | $1,200,000-14.3%$333/sqft |
Source: Public Record Report a problem | ||
| 8/1/2015 | Listed for sale | $1,400,000+12%$389/sqft |
Source: Keller Williams Realty Empire Report a problem | ||
| 8/24/2014 | Listing removed | $1,250,000$347/sqft |
Source: Citi Habitats #543288 Report a problem | ||
| 4/29/2014 | Price change | $1,250,000-10.7%$347/sqft |
Source: Citi Habitats Report a problem | ||
| 11/25/2013 | Listed for sale | $1,400,000$389/sqft |
Source: Citi-Habitats Report a problem | ||
| 6/9/2013 | Listing removed | $1,800$1/sqft |
Source: Rapid Realty Report a problem | ||
| 1/5/2013 | Listed for rent | $1,800$1/sqft |
Source: Raymond M. Report a problem | ||
Public tax history
| Year | Property taxes | Tax assessment |
|---|---|---|
| 2025 | $12,709 -0.5% | $337,500 +6.5% |
| 2024 | $12,774 | $316,800 +7.6% |
| 2023 | -- | $294,300 +1.7% |
| 2022 | -- | $289,295 +142% |
| 2021 | -- | $119,565 +3% |
| 2020 | $6,492 | $116,100 +7.5% |
| 2019 | $6,492 | $108,000 +114.3% |
| 2018 | -- | $50,408 +8% |
| 2017 | $5,938 +6.6% | $46,689 +8% |
| 2016 | $5,570 | $43,236 +8% |
| 2015 | $5,570 +53.9% | $40,037 |
| 2014 | $3,618 | $40,037 +3.3% |
| 2013 | -- | $38,776 +8% |
| 2012 | -- | $35,915 +8% |
| 2011 | -- | $33,259 +8% |
| 2010 | -- | $30,798 |
| 2009 | -- | $30,798 +3.3% |
| 2008 | -- | $29,828 |
Find assessor info on the county website
Monthly payment
Climate risks
Neighborhood: Bedford-Stuyvesant


Similar homes
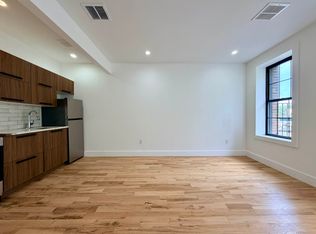
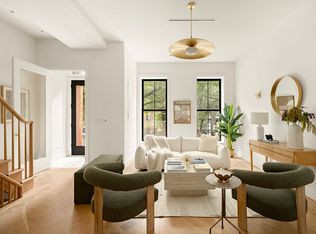
- $2,795,0006 bd7 ba3.6k sqft695 Quincy St, Brooklyn, NY 11221Active
 MLS ID #S1850628, Tali Berzak, Listing by: Compass. StreetEasy
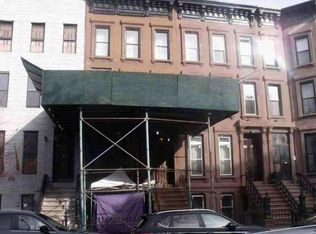
- $--8 bd4 ba3.4k sqft411 Madison St, Brooklyn, NY 11221Auction
 Auction.com 1
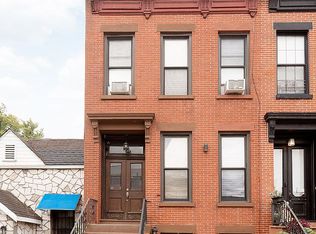
- $2,499,0006 bd6 ba4.3k sqft698 Lexington Ave, Brooklyn, NY 11221Active
 MLS ID #S1854016, Nadine Adamson, Listing by: Brown Harris Stevens. StreetEasy
- $2,895,0006 bd6 ba4.1k sqft739 Putman Ave, Brooklyn, NY 11221Active
 MLS ID #S1851898, Hong Yu Yang, Listing by: Compass. StreetEasy
