Property being sold as-is.
Active
Price increase: $5.5K (5/19)
$115,500
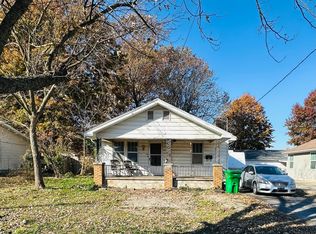
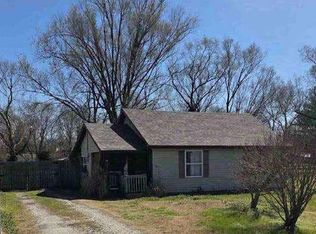
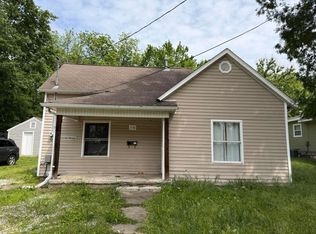
2258 N Weller Avenue, Springfield, MO 65803
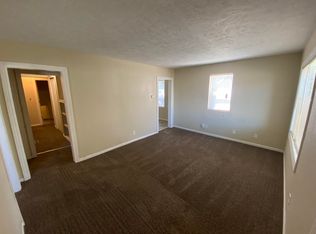
2beds
1,016sqft
Single Family Residence
Built in 1950
0.26 Acres Lot
$100,800 Zestimate®
$114/sqft
$-- HOA
What's special
- 52 days |
- 76 |
- 0 |
Zillow last checked:
Listing updated:
Listed by:
Langston Group 417-280-6661,
Murney Associates - Primrose
Source: SOMOMLS as distributed by MLS GRID,MLS#: 60323399
Loading...
Facts & features
Interior
Bedrooms & bathrooms
- Bedrooms: 2
- Bathrooms: 1
- Full bathrooms: 1
Heating
- Other, Other - See Remarks
Cooling
- None
Features
- Has basement: No
- Has fireplace: No
Interior area
- Total structure area: 1,016
- Total interior livable area: 1,016 sqft
- Finished area above ground: 1,016
- Finished area below ground: 0
Property
Features
- Levels: One
- Stories: 1
Lot
- Size: 0.26 Acres
Details
- Parcel number: 1207104027
Construction
Type & style
- Home type: SingleFamily
- Architectural style: Other
- Property subtype: Single Family Residence
Condition
- Year built: 1950
Utilities & green energy
- Sewer: Public Sewer
- Water: Public
Community & HOA
Community
- Subdivision: Greene-Not in List
Location
- Region: Springfield
Financial & listing details
- Price per square foot: $114/sqft
- Tax assessed value: $53,900
- Annual tax amount: $510
- Date on market: 5/14/2026
Estimated market value
$100,800
$78,000 - $123,000
$1,169/mo
Price history
| Date | Event | Price |
|---|---|---|
| 5/19/2026 | Price change | $115,500+5%$114/sqft |
Source: | ||
| 5/14/2026 | Price change | $110,000+10.1%$108/sqft |
Source: | ||
| 7/28/2023 | Listing removed | -- |
Source: Zillow Rentals Report a problem | ||
| 7/27/2023 | Listed for rent | $950+90%$1/sqft |
Source: Zillow Rentals Report a problem | ||
| 8/29/2019 | Listing removed | $500 |
Source: 417.Estate, Inc. #60124743 Report a problem | ||
| 12/5/2018 | Listed for rent | $500-9.1% |
Source: 417.Estate, Inc. #60124743 Report a problem | ||
| 7/4/2018 | Listing removed | $550$1/sqft |
Source: 417.rent Report a problem | ||
| 1/28/2018 | Listed for rent | $550$1/sqft |
Source: 417.rent Report a problem | ||
| 12/16/2017 | Listing removed | $550$1/sqft |
Source: 417.rent Report a problem | ||
| 11/30/2017 | Listed for rent | $550$1/sqft |
Source: 417.rent Report a problem | ||
| 5/30/2017 | Listing removed | $550$1/sqft |
Source: 417.rent Report a problem | ||
| 2/7/2017 | Listed for rent | $550$1/sqft |
Source: Zillow Rental Manager Report a problem | ||
| 9/28/2016 | Listing removed | $550+10%$1/sqft |
Source: 417.rent Report a problem | ||
| 5/31/2016 | Listed for sale | $99,900+66.8%$98/sqft |
Source: SpringfieldRealEstate.com #60054185 Report a problem | ||
| 4/21/2016 | Listing removed | $500 |
Source: iHOUSEweb, Inc. #60040826 Report a problem | ||
| 12/5/2015 | Listed for rent | $500 |
Source: iHOUSEweb, Inc. #60040826 Report a problem | ||
| 2/5/2009 | Listing removed | $59,900$59/sqft |
Source: Sawitonline.com #818128 Report a problem | ||
| 10/12/2008 | Listed for sale | $59,900$59/sqft |
Source: Sawitonline.com #818128 Report a problem | ||
| 5/27/2008 | Sold | -- |
Source: Public Record Report a problem | ||
Public tax history
| Year | Property taxes | Tax assessment |
|---|---|---|
| 2025 | $510 +22.4% | $10,240 +31.8% |
| 2024 | $417 +0.6% | $7,770 |
| 2023 | $415 -2.3% | $7,770 |
| 2022 | $424 +0% | $7,770 |
| 2021 | $424 +2.5% | $7,770 +7.2% |
| 2020 | $414 +10.7% | $7,250 +7.6% |
| 2018 | $374 +1.2% | $6,740 |
| 2017 | $369 | $6,740 |
| 2016 | $369 | $6,740 |
| 2015 | $369 +0.9% | $6,740 +2.9% |
| 2014 | $366 | $6,550 -3.7% |
| 2012 | -- | $6,800 |
| 2011 | -- | $6,800 -30.3% |
| 2010 | -- | $9,760 |
| 2006 | $442 | $9,760 |
| 2005 | $442 +3.4% | $9,760 +3.4% |
| 2004 | $427 +0.4% | $9,440 |
| 2003 | $426 +1.5% | $9,440 |
| 2002 | $419 +26.7% | $9,440 |
| 2001 | $331 | $9,440 |
Find assessor info on the county website
Monthly payment
Est. payment$--/mo
Payment breakdown
Explore the cost of this home by adjusting the details. Changes won't be saved.All calculations are estimates and provided by Zillow, Inc. for informational purposes only. Actual amounts may vary.
HOA fees may include property taxes on listings classified as Co-Ops. Contact the listing agent and/or owner for fee details.
Mortgage interest rates are dependent on a number of factors, including credit score, down payment, and repayment length. Interest rate data provided by Zillow Group Marketplace, Inc. as of 1/1/1970 from various mortgage lenders with which we have lead or other similar arrangements; the Estimated Payment is an average of those rates.
See how much you could borrow to make a competitive offer.
Climate risks
Neighborhood: Robberson
Nearby schools
GreatSchools rating
- 4/10Fremont Elementary SchoolGrades: PK-5Distance: 0.7 mi
- 2/10Reed Middle SchoolGrades: 6-8Distance: 1.5 mi
- 4/10Hillcrest High SchoolGrades: 9-12Distance: 2.2 mi
Schools provided by the listing agent
- Elementary: SGF-Fremont
- Middle: SGF-Reed
- High: SGF-Hillcrest
Source: SOMOMLS as distributed by MLS GRID. This data may not be complete. We recommend contacting the local school district to confirm school assignments for this home.
A local agent can set up tours, give advice and negotiate with sellers.


- Missouri
- Greene County
- Springfield
- 65803
- Robberson
- 2258 N Weller Avenue
Nearby cities
Nearby neighborhoods
Nearby zip codes
Other Springfield Topics
