$530,500
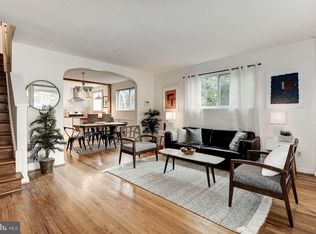
3 bd|2 ba|1k sqft
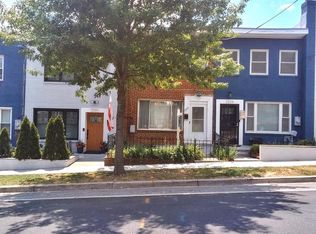
2261 16th St NE, Washington, DC 20018
Off Market
Zillow last checked:
Listing updated:
Zemede Bezuneh 703-539-5596,
Z Realtor LLC
Not available
Estimated sales range
Not available
$3,671/mo
| Date | Event | Price |
|---|---|---|
| 6/29/2026 | Price change | $599,000-7.8%$398/sqft |
Source: | ||
| 5/22/2026 | Listed for sale | $650,000-6.9%$432/sqft |
Source: | ||
| 9/11/2024 | Listing removed | $698,000$464/sqft |
Source: | ||
| 9/6/2024 | Listed for sale | $698,000+16.3%$464/sqft |
Source: | ||
| 6/29/2021 | Sold | $600,000-7.7%$399/sqft |
Source: Public Record Report a problem | ||
| 9/5/2020 | Listing removed | $3,500$2/sqft |
Source: Realty Executives Premier #DCDC482646 Report a problem | ||
| 8/21/2020 | Listed for rent | $3,500$2/sqft |
Source: Realty Executives Premier #DCDC482646 Report a problem | ||
| 5/20/2020 | Listing removed | $650,000$432/sqft |
Source: Realty Executives Premier #DCDC460092 Report a problem | ||
| 3/9/2020 | Listed for sale | $650,000+83.1%$432/sqft |
Source: Realty Executives Premier #DCDC460092 Report a problem | ||
| 2/10/2020 | Sold | $355,000$236/sqft |
Source: Public Record Report a problem | ||
| Year | Property taxes | Tax assessment |
|---|---|---|
| 2025 | $5,623 +1% | $661,510 +1% |
| 2024 | $5,565 +2.2% | $654,730 +2.2% |
| 2023 | $5,445 -1.2% | $640,620 -1.2% |
| 2022 | $5,509 +42.1% | $648,150 +42.1% |
| 2021 | $3,878 +5% | $456,200 +5% |
| 2020 | $3,691 +21.5% | $434,290 +21.5% |
| 2018 | $3,039 +9.1% | $357,510 +9.1% |
| 2017 | $2,786 +15.4% | $327,820 +15.4% |
| 2016 | $2,415 +12.1% | $284,100 +12.1% |
| 2015 | $2,154 +5.9% | $253,360 +5.9% |
| 2014 | $2,033 +0.7% | $239,180 +0.7% |
| 2013 | $2,019 -6% | $237,580 -6% |
| 2012 | $2,149 | $252,830 |
| 2011 | $2,149 -10.8% | $252,830 -10.8% |
| 2010 | $2,410 -3.1% | $283,550 -3.1% |
| 2009 | $2,486 +19.2% | $292,490 +23.4% |
| 2007 | $2,086 +50% | $236,990 +56.8% |
| 2006 | $1,390 +14.6% | $151,120 +19.5% |
| 2005 | $1,214 +18.1% | $126,420 +18.1% |
| 2004 | $1,027 +16.1% | $107,020 +16.1% |
| 2003 | $885 +4% | $92,170 +4% |
| 2002 | $851 -11.5% | $88,628 +6% |
| 2001 | $962 | $83,611 |
Find assessor info on the county website
Source: Bright MLS. This data may not be complete. We recommend contacting the local school district to confirm school assignments for this home.
A local agent can set up tours, give advice and negotiate with sellers.