Welcome to 2263 E Thomas Ave, a rare multi-unit investment property offering five well-positioned units.This income-producing asset is ideal for both seasoned investors and those looking to expand their portfolio. With consistent rental demand in the area, this property presents an excellent opportunity for immediate income generation and future rent growth. Whether you're seeking a turnkey asset or a value-add opportunity, 2263 E Thomas Ave delivers flexibility, location, and income potential in one compelling package.
For sale
Price increase: $900 (11/13)
$424,900
2263 E Thomas Avenue, Fresno, CA 93701
5beds
5baths
2,942sqft
Multi Family
Built in 1948
-- sqft lot
$-- Zestimate®
$144/sqft
$-- HOA
What's special
- 1 day
- 70
- 2
Zillow last checked:
Listing updated:
Listed by:
Marie Meza 559-246-4905,
eXp Realty of Greater Los Angeles, Inc.
Source: TCMLS,MLS#: 245100
Facts & features
Interior
Bedrooms & bathrooms
- Bedrooms: 5
- Bathrooms: 5
Heating
- Central
Cooling
- Central Air
Interior area
- Total structure area: 2,942
- Total interior livable area: 2,942 sqft
Property
Features
- Stories: 1
Lot
- Size: 0.45 Acres
- Dimensions: 100' x 198'
Details
- Parcel number: 45223525
- Zoning: RS5
- Zoning description: RS5
Construction
Type & style
- Home type: MultiFamily
- Property subtype: Multi Family
Materials
- Stucco
- Foundation: Concrete Perimeter, Slab
- Roof: Composition,Shingle
Condition
- New construction: No
- Year built: 1948
Utilities & green energy
- Sewer: Public Sewer
- Water: Public
- Utilities for property: Electricity Connected, Natural Gas Connected, Sewer Connected, Water Connected
Community & HOA
HOA
- Has HOA: No
Location
- Region: Fresno
Financial & listing details
- Price per square foot: $144/sqft
- Tax assessed value: $174,083
- Date on market: 11/13/2026
- Cumulative days on market: 124 days
- Tenant pays: All Utilities
- Income includes: Rent Only
- Electric utility on property: Yes
Estimated market value
Not available
Estimated sales range
Not available
$2,120/mo
Price history
| Date | Event | Price |
|---|---|---|
| 11/13/2026 | Price change | $424,900+0.2%$144/sqft |
Source: eXp Realty #235277 Report a problem | ||
| 11/13/2026 | Price change | $424,000-0.2%$144/sqft |
Source: MetroList Services of CA #226138111 Report a problem | ||
| 11/10/2026 | Listed for sale | $424,900$144/sqft |
Source: Fresno MLS #648133 Report a problem | ||
| 10/21/2026 | Pending sale | $424,900$144/sqft |
Source: eXp Realty #FR26095358 Report a problem | ||
| 8/1/2026 | Contingent | $424,900$144/sqft |
Source:  TCMLS #241434 Report a problem | ||
| 8/1/2026 | Pending sale | $424,900$144/sqft |
Source: Fresno MLS #648133 Report a problem | ||
| 7/31/2026 | Price change | $424,900-4.5%$144/sqft |
Source: Fresno MLS #648133 Report a problem | ||
| 7/15/2026 | Price change | $445,000-2.2%$151/sqft |
Source: Fresno MLS #648133 Report a problem | ||
| 6/23/2026 | Price change | $454,900-4.2%$155/sqft |
Source: Fresno MLS #648133 Report a problem | ||
| 5/2/2026 | Listed for sale | $474,900+216.6%$161/sqft |
Source: Fresno MLS #648133 Report a problem | ||
| 3/29/2018 | Sold | $150,000+71.4%$51/sqft |
Source: Public Record Report a problem | ||
| 7/18/1994 | Sold | $87,500$30/sqft |
Source: Public Record Report a problem | ||
Public tax history
| Year | Property taxes | Tax assessment |
|---|---|---|
| 2026 | -- | $174,083 +2% |
| 2025 | $2,300 +3.8% | $170,670 +2% |
| 2024 | $2,216 +1.9% | $167,324 +2% |
| 2023 | $2,174 +1.3% | $164,044 +2% |
| 2022 | $2,146 +2.7% | $160,829 +2% |
| 2021 | $2,089 +0.4% | $157,676 +1% |
| 2020 | $2,080 +3.9% | $156,060 +2% |
| 2019 | $2,003 +17.7% | $153,000 +18.5% |
| 2018 | $1,701 +1.7% | $129,146 +2% |
| 2017 | $1,673 +3.2% | $126,615 +2% |
| 2016 | $1,621 +1.5% | $124,134 +1.5% |
| 2015 | $1,597 +2.5% | $122,270 +2% |
| 2014 | $1,559 | $119,876 +19.9% |
| 2013 | -- | $100,000 |
| 2012 | -- | $100,000 -12.8% |
| 2011 | -- | $114,701 +0.8% |
| 2010 | -- | $113,844 -0.2% |
| 2009 | -- | $114,116 +2% |
| 2008 | -- | $111,880 +2% |
| 2007 | -- | $109,687 +2% |
| 2006 | -- | $107,538 +2% |
| 2005 | -- | $105,430 +2% |
| 2004 | -- | $103,363 +1.9% |
| 2003 | -- | $101,470 +2% |
| 2002 | -- | $99,482 +2% |
| 2001 | $1,251 | $97,532 |
Find assessor info on the county website
Monthly payment
Est. payment
Payment breakdown
Explore the cost of this home by adjusting the details. Changes won't be saved.Climate risks
Neighborhood: Central


Similar homes
- $569,0005 bd5 ba2.8k sqftNorth Calaveras, Fresno, CA 93701For Sale
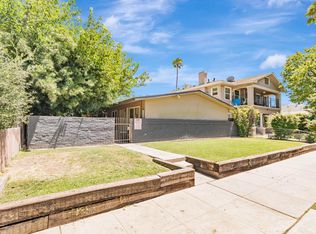 MLS ID #ML82062073, Robert M. Balina. MLSListings Inc
- $335,0005 bd4 ba2.5k sqft362 N Calaveras St, Fresno, CA 93701For Sale
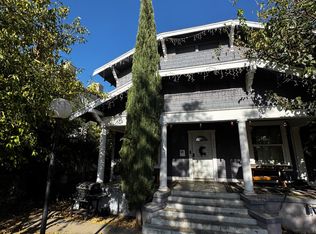 MLS ID #657451, Eric D. Tenorio. Fresno MLS
- $499,5005 bd4 ba2.4k sqft332 N Roosevelt Ave, Fresno, CA 93701For Sale
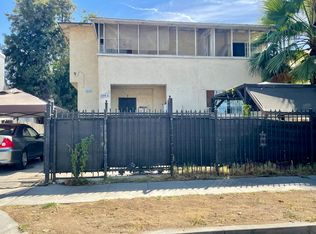 MLS ID #653473, Cherie M. Smith. Fresno MLS
- $419,9998 bd6 ba2.1k sqft2146 W Dudley Ave #2, Fresno, CA 93728For Sale
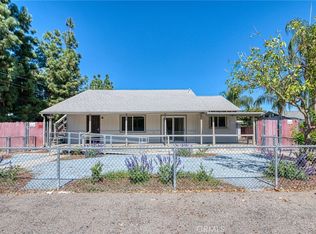 MLS ID #FR26218633, Eugene O'Brien, Central California Real Estate Pros. CRMLS
