$188,600
3 bd|1 ba|925 sqft
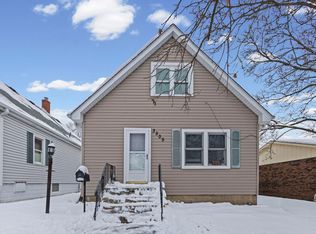
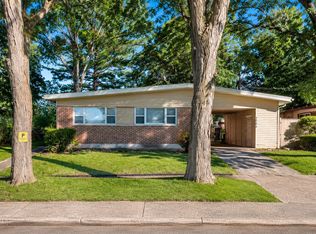
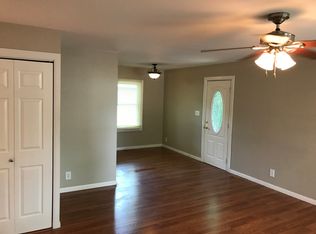
227 W 35th St, Steger, IL 60475
Off Market
Likely to sell faster than
Zillow last checked:
Amy Gugliuzza (224)699-5002,
Redfin Corporation
Not available
Estimated sales range
Not available
Not available
| Date | Event | Price |
|---|---|---|
| 6/11/2026 | Listing removed | $190,000$165/sqft |
Source: | ||
| 5/28/2026 | Listed for sale | $190,000+69.6%$165/sqft |
Source: | ||
| 3/20/2024 | Listing removed | -- |
Source: Zillow Rentals Report a problem | ||
| 3/17/2024 | Listed for rent | $1,800+5.9%$2/sqft |
Source: Zillow Rentals Report a problem | ||
| 2/24/2022 | Listing removed | -- |
Source: Zillow Rental Manager Report a problem | ||
| 2/21/2022 | Listed for rent | $1,700+13.3%$1/sqft |
Source: Zillow Rental Manager Report a problem | ||
| 5/10/2021 | Listing removed | -- |
Source: Zillow Rental Manager Report a problem | ||
| 5/6/2021 | Listed for rent | $1,500$1/sqft |
Source: Zillow Rental Manager Report a problem | ||
| 10/16/2020 | Sold | $112,000+1.8%$97/sqft |
Source: | ||
| 8/26/2020 | Pending sale | $110,000$95/sqft |
Source: RE/MAX Synergy #10826506 Report a problem | ||
| 8/26/2020 | Listed for sale | $110,000$95/sqft |
Source: RE/MAX Synergy #10826506 Report a problem | ||
| 8/26/2020 | Pending sale | $110,000$95/sqft |
Source: RE/MAX Synergy #10826506 Report a problem | ||
| 8/21/2020 | Listed for sale | $110,000+32.7%$95/sqft |
Source: RE/MAX Synergy #10826506 Report a problem | ||
| 3/30/2015 | Sold | $82,900$72/sqft |
Source: | ||
| 2/20/2015 | Pending sale | $82,900$72/sqft |
Source: McColly Real Estate #08831862 Report a problem | ||
| 2/6/2015 | Listed for sale | $82,900+373.7%$72/sqft |
Source: McColly Real Estate #08831862 Report a problem | ||
| 11/20/2014 | Sold | $17,500+2.9%$15/sqft |
Source: Public Record Report a problem | ||
| 10/23/2014 | Price change | $17,000-28.9%$15/sqft |
Source: RE/MAX 2000 #08722912 Report a problem | ||
| 10/21/2014 | Price change | $23,900-14.3%$21/sqft |
Source: RE/MAX 2000 #08722912 Report a problem | ||
| 9/10/2014 | Listed for sale | $27,900-64.2%$24/sqft |
Source: RE/MAX 2000 #08722912 Report a problem | ||
| 1/16/2008 | Sold | $78,000-1.3%$68/sqft |
Source: Public Record Report a problem | ||
| 7/23/2004 | Sold | $79,000$69/sqft |
Source: Public Record Report a problem | ||
| Year | Property taxes | Tax assessment |
|---|---|---|
| 2024 | $3,773 +8.4% | $44,474 +12% |
| 2023 | $3,479 +4.4% | $39,713 +12.5% |
| 2022 | $3,334 +7.7% | $35,294 +9.2% |
| 2021 | $3,097 +4.6% | $32,314 +6.7% |
| 2020 | $2,961 +6.4% | $30,285 +6.4% |
| 2019 | $2,783 +4.2% | $28,463 +2.2% |
| 2018 | $2,671 +3.4% | $27,850 +8.6% |
| 2017 | $2,583 -4.9% | $25,656 +0.6% |
| 2016 | $2,715 -21.5% | $25,491 +2.7% |
| 2015 | $3,459 | $24,809 -1% |
| 2014 | $3,459 +3.6% | $25,059 -4.6% |
| 2013 | $3,340 -4.6% | $26,259 -8% |
| 2012 | $3,502 +16.6% | $28,543 -9.5% |
| 2011 | $3,003 +2.4% | $31,539 -6% |
| 2010 | $2,933 +6.3% | $33,540 -5.9% |
| 2009 | $2,758 -2.8% | $35,643 |
| 2008 | $2,839 | $35,643 +4.1% |
| 2007 | -- | $34,229 +6.5% |
| 2006 | $2,904 +4.2% | $32,125 +5.3% |
| 2005 | $2,789 +29.2% | $30,508 +9.1% |
| 2004 | $2,158 +4.9% | $27,963 +4% |
| 2003 | $2,058 -11% | $26,885 +6% |
| 2002 | $2,311 +1.5% | $25,363 +2.8% |
| 2001 | $2,277 +9.6% | $24,679 +5.8% |
| 2000 | $2,078 | $23,326 |
Find assessor info on the county website
Source: MRED as distributed by MLS GRID. This data may not be complete. We recommend contacting the local school district to confirm school assignments for this home.
A local agent can set up tours, give advice and negotiate with sellers.
A local lender can help you make sure your offer is ready when you are.