Call Enrique Moreno for showings 760.625.6814Beautiful 4-bedroom, 2-bath manufactured home on a permanent foundation in Salton City. Features include high ceilings, a modern fireplace, brand-new energy-efficient dual-pane windows, luxury laminate flooring, and quartz countertops throughout the kitchen and bathrooms.
For sale
Listed by: eXp Realty Of Southern California Inc • Enrique Moreno • 760-625-6814
$290,000
2327 Sand Quill Ave, Thermal, CA 92274
4beds
1,568sqft
Single Family Residence
Built in 2006
10,438 Square Feet Lot
$287,100 Zestimate®
$185/sqft
$-- HOA
What's special
Modern fireplaceLuxury laminate flooringHigh ceilingsBrand-new energy-efficient dual-pane windows
- 15 days
- 361
- 29
Zillow last checked:
Listing updated:
Listed by:
Enrique Moreno DRE #02151337 760-625-6814,
eXp Realty Of Southern California Inc
Source: CRMLS,MLS#: 219153769DA Originating MLS: California Desert AOR & Palm Springs AOR
Facts & features
Interior
Bedrooms & bathrooms
- Bedrooms: 4
- Bathrooms: 2
- Full bathrooms: 2
Rooms
- Room types: Other
Heating
- Central
Cooling
- Central Air
Features
- Flooring: Laminate
- Has fireplace: Yes
- Fireplace features: Living Room, Propane
Interior area
- Total interior livable area: 1,568 sqft
Property
Parking
- Parking features: Assigned, Driveway
Features
- Levels: One
- Stories: 1
- Has view: Yes
- View description: Mountain(s)
Lot
- Size: 10,438 Square Feet
Details
- Parcel number: 012253006000
- Special conditions: Standard
Construction
Type & style
- Home type: SingleFamily
- Property subtype: Single Family Residence
- Attached to another structure: Yes
Condition
- New construction: No
- Year built: 2006
Community & HOA
Community
- Security: 24 Hour Security
- Subdivision: West Shores
Location
- Region: Thermal
Financial & listing details
- Price per square foot: $185/sqft
- Tax assessed value: $259,782
- Date on market: 10/4/2026
- Listing terms: Conventional,FHA,VA Loan
Estimated market value
$287,100
$273,000 - $301,000
$2,030/mo
Price history
| Date | Event | Price |
|---|---|---|
| 10/5/2026 | Listed for sale | $290,000+20.8%$185/sqft |
Source:  Greater Palm Springs Realtors #219153769 Report a problem | ||
| 3/19/2022 | Sold | $240,000+4.4%$153/sqft |
Source:  CDAR/ Desert Area MLS #219073755 Report a problem | ||
| 2/15/2022 | Pending sale | $229,995$147/sqft |
Source: CDAR/ Desert Area MLS #219073755 Report a problem | ||
| 2/10/2022 | Listed for sale | $229,995+900%$147/sqft |
Source: CDAR/ Desert Area MLS #219073755 Report a problem | ||
| 2/5/2022 | Listing removed | -- |
Source: Zillow Rental Manager Report a problem | ||
| 1/30/2022 | Listed for rent | $1,700$1/sqft |
Source: Zillow Rental Manager Report a problem | ||
| 2/12/2021 | Sold | $23,000+130%$15/sqft |
Source: Public Record Report a problem | ||
| 6/27/2017 | Sold | $10,000-20%$6/sqft |
Source: Public Record Report a problem | ||
| 7/22/2015 | Sold | $12,500-61.5%$8/sqft |
Source: Public Record Report a problem | ||
| 2/3/2006 | Sold | $32,500$21/sqft |
Source: Public Record Report a problem | ||
Public tax history
| Year | Property taxes | Tax assessment |
|---|---|---|
| 2026 | -- | $259,782 +2% |
| 2025 | $4,552 +2.4% | $254,689 +2% |
| 2024 | $4,444 +1.7% | $249,696 +2% |
| 2023 | $4,368 | $244,800 +2% |
| 2022 | -- | $240,000 +2161.6% |
| 2021 | $1,040 +28.2% | $10,612 |
| 2020 | $811 +6.5% | $10,612 +2% |
| 2019 | $762 | $10,404 +2% |
| 2018 | $762 +12.8% | $10,200 -5% |
| 2017 | $675 +8.3% | $10,737 +2% |
| 2016 | $624 -52.8% | $10,527 -83.6% |
| 2015 | $1,322 | $64,288 |
| 2014 | $1,322 | $64,288 |
| 2013 | -- | $64,288 |
| 2012 | -- | $64,288 |
| 2011 | -- | $64,288 -31.7% |
| 2010 | -- | $94,080 |
| 2009 | -- | $94,080 |
| 2008 | -- | $94,080 |
Find assessor info on the county website
Monthly payment
Est. payment
Payment breakdown
Explore the cost of this home by adjusting the details. Changes won't be saved.Climate risks
Neighborhood: 92274

Similar homes
- $314,9994 bd2 ba1.2k sqft1223 Glendale Ave, Thermal, CA 92274For Sale
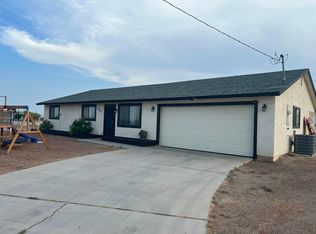 MLS ID #219151231DA, Preci Meza, Keller Williams Realty. CRMLS
- $274,9993 bd2 ba1.4k sqft956 Brazil Ave, Salton City, CA 92275For Sale
 MLS ID #219154393DA, Beny Castro, Equity Smart Real Estate Servi. CRMLS
- $--3 bd2 ba1.4k sqft2844 Leto Ave, Thermal, CA 92274Auction
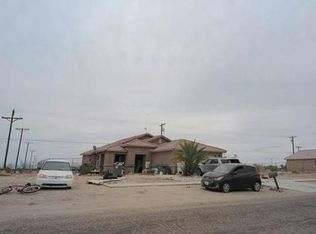 Auction.com 1
- $305,0003 bd2 ba1.3k sqft1289 Avalon Ave, Thermal, CA 92274For Sale
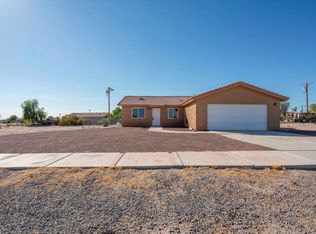 MLS ID #219152035DA, Ana Perez & Associates, ROA California Inc.. CRMLS
