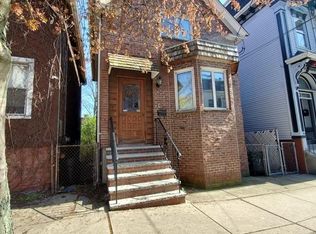
Single family house in need of complete renovation/ or tear down. Property has not been occupied for many years. Estate sale. No one has been in the house. All information from public records only. No showings or open houses. Property will not qualify for financing, only cash buyers. Please call listing agent for any information.
Pending
$439,000
233 Princeton St, East Boston, MA 02128
0beds
0baths
1,396sqft
Single Family Residence
Built in 1900
1,575 Square Feet Lot
$457,000 Zestimate®
$314/sqft
$-- HOA
What's special
- 21 days
- 494
- 16
Likely to sell faster than
Zillow last checked:
Listing updated:
Listed by:
Joanne Mulkerin 781-983-0251,
J. Mulkerin Realty 781-933-7200
Source: MLS PIN,MLS#: 73594232
Facts & features
Interior
Bedrooms & bathrooms
- Bedrooms: 0
- Bathrooms: 0
Heating
- None
Cooling
- None
Features
- Has basement: Yes
- Has fireplace: No
Interior area
- Total structure area: 1,396
- Total interior livable area: 1,396 sqft
- Finished area above ground: 1,396
Property
Lot
- Size: 1,575 Square Feet
- Features: Level
Details
- Parcel number: 1333724
- Zoning: R1
Construction
Type & style
- Home type: SingleFamily
- Architectural style: Colonial
- Property subtype: Single Family Residence
Materials
- Frame
- Foundation: Stone, Brick/Mortar
Condition
- Year built: 1900
Utilities & green energy
- Sewer: Other
- Water: Other
Community & HOA
Community
- Features: Public Transportation
HOA
- Has HOA: No
Location
- Region: East Boston
Financial & listing details
- Price per square foot: $314/sqft
- Tax assessed value: $401,200
- Annual tax amount: $4,646
- Date on market: 10/22/2026
- Road surface type: Paved
Estimated market value
$457,000
$411,000 - $498,000
$2,752/mo
Price history
| Date | Event | Price |
|---|---|---|
| 11/6/2026 | Pending sale | $439,000$314/sqft |
Source: MLS PIN #73594232 Report a problem | ||
| 10/30/2026 | Contingent | $439,000$314/sqft |
Source: MLS PIN #73594232 Report a problem | ||
| 10/22/2026 | Listed for sale | $439,000$314/sqft |
Source: MLS PIN #73594232 Report a problem | ||
Public tax history
| Year | Property taxes | Tax assessment |
|---|---|---|
| 2025 | $4,646 +12.5% | $401,200 +5.9% |
| 2024 | $4,130 +1.5% | $378,900 |
| 2023 | $4,069 +4.6% | $378,900 +6% |
| 2022 | $3,890 +6.1% | $357,500 +4% |
| 2021 | $3,668 +16% | $343,800 +14.9% |
| 2020 | $3,161 +12.3% | $299,300 +12% |
| 2019 | $2,816 +10.6% | $267,200 +10% |
| 2018 | $2,546 +2210.1% | $242,900 +9% |
| 2017 | $110 -95.4% | $222,800 +2% |
| 2016 | $2,402 +38.5% | $218,400 +52.5% |
| 2015 | $1,734 +8.5% | $143,200 +17.8% |
| 2013 | $1,598 -13.2% | $121,600 -13.8% |
| 2012 | $1,840 +1.9% | $141,100 |
| 2011 | $1,805 +2.3% | $141,100 -5% |
| 2010 | $1,765 +5.4% | $148,600 -5.7% |
| 2009 | $1,674 -18.9% | $157,500 -16.3% |
| 2008 | $2,065 -5.4% | $188,200 -5.2% |
| 2007 | $2,182 | $198,500 |
Find assessor info on the county website
Monthly payment
Est. payment
Payment breakdown
Explore the cost of this home by adjusting the details. Changes won't be saved.Climate risks
Neighborhood: East Boston


Similar homes
- $425,0003 bd1 ba940 sqft87 Bailey Street Condomimiums, Dorchester, MA 02124For Sale
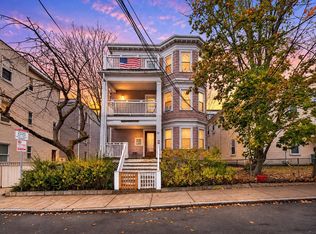 MLS ID #73600850, Mission Impossible Team, United Brokers. MLS PIN
- $399,0003 bd1 ba1.2k sqftThe Imperial, Chelsea, MA 02150For Sale
 MLS ID #73597924, Jeffrey Bowen, eRealty Advisors, Inc.. MLS PIN
- $349,9002 bd1 ba741 sqft379 Meridian St #101, East Boston, MA 02128For Sale
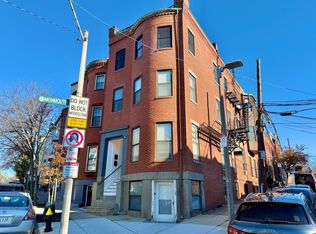 MLS ID #73473410, Kevin Li, MP Signature Realty LLC. MLS PIN
- $535,0003 bd1 ba1.2k sqft161 Shawmut St, Chelsea, MA 02150For Sale
 MLS ID #73571828, Marisol Franco, Coldwell Banker Realty - Western MA. MLS PIN
