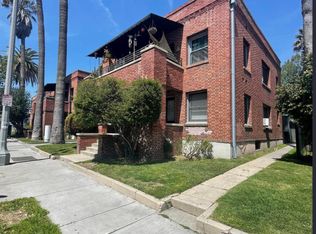
The Villas is a charming 12-unit apartment building located at 231 and 239 East Villa Street, Pasadena, CA 91101. The property was built in 1913 and is located on the northeast corner of East Villa Street and North Marengo Avenue. The lot is approximately 19,334 square feet. The Villas is located a few blocks away from restaurants, shops, and entertainment on Colorado Boulevard, and a few blocks away from Old Town Pasadena. The unit mix consists of 12 one-bedroom/one-bathroom units. There is a large shared yard. There is a laundry room, assigned parking spaces, 6 garages, and storage spaces. Some of the units have balconies, and some of the units have porches. The property is designated historic-eligible by the City of Pasadena. (Buyer to verify)
For sale
$3,675,000
239 E Villa St, Pasadena, CA 91101
12beds
12baths
8,502sqft
Multi Family
Built in 1913
-- sqft lot
$-- Zestimate®
$432/sqft
$-- HOA
What's special
- 118 days
- 104
- 11
Zillow last checked:
Listing updated:
Listed by:
Gayle Factor DRE # 01066258 818-437-7801,
Marcus & Millichap 818-212-2700
Source: CLAW,MLS#: 26862273
Facts & features
Interior
Bedrooms & bathrooms
- Bedrooms: 12
- Bathrooms: 12
Heating
- Other
Cooling
- Other
Appliances
- Laundry: Laundry Area
Interior area
- Total structure area: 8,502
- Total interior livable area: 8,502 sqft
Property
Parking
- Total spaces: 14
- Parking features: Assigned
- Garage spaces: 6
Features
- Levels: One
- Stories: 2
Lot
- Size: 0.44 Acres
Details
- Additional structures: None
- Has additional parcels: Yes
- Parcel number: 5725017001
- Zoning: PSR1
- Special conditions: Standard
- Other equipment: Other
Construction
Type & style
- Home type: MultiFamily
- Property subtype: Multi Family
Condition
- Year built: 1913
Community & HOA
Location
- Region: Pasadena
Financial & listing details
- Price per square foot: $432/sqft
- Tax assessed value: $2,013,088
- Date on market: 7/21/2026
Estimated market value
Not available
Estimated sales range
Not available
$2,610/mo
Price history
| Date | Event | Price |
|---|---|---|
| 7/21/2026 | Listed for sale | $3,675,000$432/sqft |
Source:  CLAW #26862273 Report a problem | ||
| 4/8/2023 | Listing removed | -- |
Source: Zillow Rentals Report a problem | ||
| 4/6/2023 | Listed for rent | $2,200+3.5% |
Source: Zillow Rentals Report a problem | ||
| 10/18/2022 | Listing removed | -- |
Source: Zillow Rental Manager Report a problem | ||
| 10/13/2022 | Listed for rent | $2,125+11.8% |
Source: Zillow Rental Manager Report a problem | ||
| 11/24/2021 | Listing removed | -- |
Source: Zillow Rental Manager Report a problem | ||
| 11/16/2021 | Listed for rent | $1,900 |
Source: Zillow Rental Manager Report a problem | ||
Public tax history
| Year | Property taxes | Tax assessment |
|---|---|---|
| 2026 | -- | $2,054,308 +2% |
| 2025 | $25,514 +4.9% | $2,014,048 +2% |
| 2024 | $24,326 +0.8% | $1,974,577 +2% |
| 2023 | $24,125 +3.4% | $1,935,880 +2% |
| 2022 | $23,325 +4.2% | $1,897,941 +2% |
| 2021 | $22,376 +3.9% | $1,860,746 +1% |
| 2020 | $21,531 | $1,841,678 +2% |
| 2019 | $21,531 -1.6% | $1,805,587 +2% |
| 2018 | $21,872 | $1,770,203 +2.1% |
| 2017 | $21,872 +1.1% | $1,734,553 +2% |
| 2016 | $21,629 +2.4% | $1,700,543 +16.2% |
| 2015 | $21,120 +16.1% | $1,463,900 +2% |
| 2014 | $18,199 | $1,435,225 +4.5% |
| 2011 | -- | $1,373,262 +0.8% |
| 2010 | -- | $1,363,000 +11.4% |
| 2009 | -- | $1,224,000 +247.5% |
| 2007 | -- | $352,256 +2% |
| 2006 | -- | $345,350 |
| 2005 | -- | $345,350 +6% |
| 2003 | -- | $325,860 +2% |
| 2002 | -- | $319,472 +4% |
| 2000 | -- | $307,068 |
Find assessor info on the county website
Monthly payment
Est. payment
Payment breakdown
Explore the cost of this home by adjusting the details. Changes won't be saved.Climate risks
Neighborhood: West Central


Similar homes
- $2,850,00011 bd7 ba5k sqft425 N Raymond Ave, Pasadena, CA 91103For Sale
 MLS ID #AR26119886, Handoko Chen, Growth Investment Group Pasade. CRMLS
- $2,599,00010 bd9 ba5k sqft481 Lincoln Ave, Pasadena, CA 91103For Sale
 MLS ID #TR26131676, Kevin Lee, Coldwell Banker Envision. CRMLS
- $3,285,00014 bd8 ba5.8k sqft83 S Daisy Ave, Pasadena, CA 91107For Sale
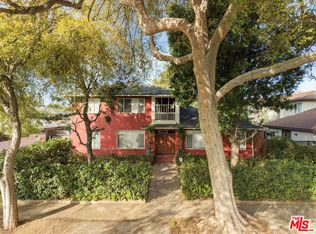 MLS ID #26104677, Jake Glaser DRE # 02128816, Lyon Stahl Investment Real Estate, Inc.. CLAW
- $3,950,00013 bd14 ba8.2k sqft327 Riverdale Dr, Glendale, CA 91204For Sale
 MLS ID #AR26185366, Steve Kwon, Keller Williams Realty. CRMLS
