Cash-flowing duplex in the heart of Midtown Memphis. Both units occupied with long-standing tenants, generating income from day one of closing! Ideally suited for the out-of-state investor seeking a hands-off, asset. Unit 1 and Unit 2 are both leased, providing immediate, stabilized rental income with no lease-up period or vacancy risk. Located near Broad Avenue's shops and restaurants and just minutes from the Memphis Zoo and Overton Park, this Midtown location keeps tenant demand strong. Solid bones, established rental history, and consistent cash flow — everything an out-of-state buyer wants in an investment. Financials available upon request. Schedule your due diligence review today!
For sale
$150,000
2435 Forrest Ave, Memphis, TN 38112
--beds
--baths
1,636sqft
Multi Family
Built in 1922
-- sqft lot
$-- Zestimate®
$92/sqft
$-- HOA
What's special
- 42 days
- 85
- 6
Zillow last checked:
Listing updated:
Listed by:
Bradley Puckett,
Reedy & Company, REALTORS 901-842-0805
Source: MAAR,MLS#: 10230280
Facts & features
Interior
Heating
- Central
Cooling
- Central Air
Appliances
- Included: Electric Water Heater
- Laundry: Connections
Features
- Flooring: Vinyl
Interior area
- Total interior livable area: 1,636 sqft
Property
Parking
- Parking features: Concrete
Features
- Stories: 1
Lot
- Size: 6,650 Square Feet
- Dimensions: 50 x 133
Details
- Parcel number: 033001 00054
Construction
Type & style
- Home type: MultiFamily
- Property subtype: Multi Family
Materials
- Brick, Vinyl Siding
- Foundation: Slab
- Roof: Shingle/Shake
Condition
- Year built: 1922
Community & HOA
Community
- Subdivision: Misses Hanson
Location
- Region: Memphis
Financial & listing details
- Price per square foot: $92/sqft
- Tax assessed value: $168,500
- Annual tax amount: $3,552
- Date on market: 9/11/2026
- Cumulative days on market: 42 days
- Listing terms: Conventional
- Lease term: 12 Months
- Tenant pays: All Utilities
Estimated market value
Not available
Estimated sales range
Not available
$1,323/mo
Price history
| Date | Event | Price |
|---|---|---|
| 9/11/2026 | Listed for sale | $150,000+11.2%$92/sqft |
Source:  MAAR #10230280 Report a problem | ||
| 2/17/2025 | Listing removed | $134,900$82/sqft |
Source: MAAR #10185414 Report a problem | ||
| 2/11/2025 | Pending sale | $134,900$82/sqft |
Source: MAAR #10185414 Report a problem | ||
| 12/17/2024 | Price change | $134,900-3.6%$82/sqft |
Source: MAAR #10185414 Report a problem | ||
| 12/13/2024 | Pending sale | $140,000$86/sqft |
Source: MAAR #10185414 Report a problem | ||
| 11/18/2024 | Listed for sale | $140,000+7.7%$86/sqft |
Source: MAAR #10185414 Report a problem | ||
| 7/31/2024 | Listing removed | -- |
Source: Zillow Rentals Report a problem | ||
| 7/2/2024 | Listed for rent | $695-12% |
Source: Zillow Rentals Report a problem | ||
| 6/24/2024 | Listing removed | -- |
Source: Zillow Rentals Report a problem | ||
| 1/1/2024 | Listed for rent | $790+21.5% |
Source: Zillow Rentals Report a problem | ||
| 1/27/2023 | Listing removed | -- |
Source: MAAR #10139056 Report a problem | ||
| 12/14/2022 | Listed for sale | $130,000+79.3%$79/sqft |
Source: MAAR #10139056 Report a problem | ||
| 12/3/2021 | Listing removed | -- |
Source: Zillow Rental Network Premium Report a problem | ||
| 10/12/2021 | Listed for rent | $650 |
Source: Zillow Rental Network Premium Report a problem | ||
| 9/30/2021 | Listing removed | -- |
Source: Zillow Rental Network Premium Report a problem | ||
| 9/28/2021 | Listed for rent | $650+16.1% |
Source: Zillow Rental Network Premium Report a problem | ||
| 5/15/2020 | Listing removed | $560 |
Source: Lubin Property Management, LLC #10070843 Report a problem | ||
| 3/24/2020 | Sold | $72,500+437%$44/sqft |
Source: Public Record Report a problem | ||
| 2/14/2020 | Listed for rent | $560+1.8% |
Source: Lubin Property Management, LLC #10070843 Report a problem | ||
| 12/16/2019 | Listing removed | $550 |
Source: Zillow Rental Manager Report a problem | ||
| 12/7/2019 | Listed for rent | $550 |
Source: Zillow Rental Manager Report a problem | ||
| 11/20/2008 | Sold | $13,500$8/sqft |
Source: Public Record Report a problem | ||
Public tax history
| Year | Property taxes | Tax assessment |
|---|---|---|
| 2025 | $3,553 +90.2% | $67,400 +137.7% |
| 2024 | $1,868 +8.1% | $28,360 |
| 2023 | $1,728 | $28,360 |
| 2022 | -- | $28,360 |
| 2021 | -- | $28,360 +36.6% |
| 2020 | $663 | $20,760 |
| 2019 | $663 -21.1% | $20,760 |
| 2018 | $841 -45.1% | $20,760 |
| 2017 | $1,532 +68.7% | $20,760 -22.3% |
| 2016 | $908 +103.5% | $26,720 |
| 2014 | $446 | $26,720 |
| 2013 | -- | $26,720 +90.9% |
| 2012 | -- | $14,000 |
| 2011 | -- | $14,000 |
| 2010 | -- | $14,000 -65.6% |
| 2009 | -- | $40,640 +79.8% |
| 2008 | -- | $22,600 |
| 2007 | -- | $22,600 |
| 2006 | -- | $22,600 |
| 2005 | -- | $22,600 +6.8% |
| 2004 | -- | $21,160 |
| 2003 | -- | $21,160 |
| 2002 | -- | $21,160 |
| 2001 | -- | $21,160 +19.1% |
| 2000 | -- | $17,760 |
Find assessor info on the county website
Monthly payment
Est. payment
Payment breakdown
Explore the cost of this home by adjusting the details. Changes won't be saved.Climate risks
Neighborhood: Binghampton

Similar homes
- $153,0004 bd2 ba1.5k sqft3464 Coleman Ave, Memphis, TN 38122For Sale
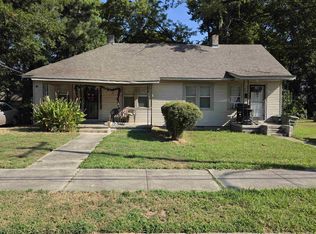 MLS ID #10229548, Dean Harris, CrestCore Realty MphsBrokerage. MAAR
- $124,9002 bd2 ba1.4k sqft3017 Spottswood Ave, Memphis, TN 38111For Sale
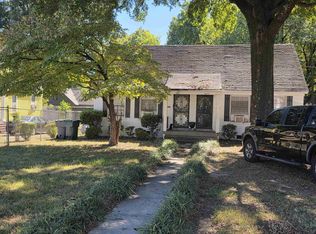 MLS ID #10232683, Dean Harris, CrestCore Realty MphsBrokerage. MAAR
- $--3 bd2 ba1.5k sqft924 Oakmont Pl, Memphis, TN 38107Auction
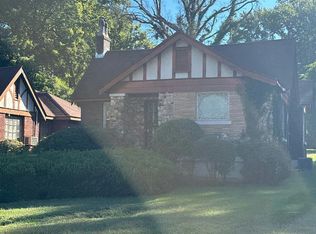 Auction.com 2
- $--3 bd1 ba1.4k sqft3155 Kimball Ave, Memphis, TN 38114Auction
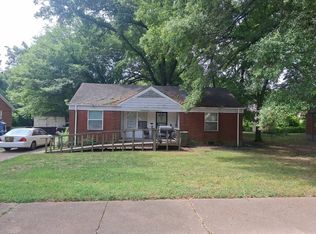 Auction.com 2
