Residential Income property with potential for the right buyer. 3 houses on 1 expansive lot. Bring your vision and tool belt. Great location, close to downtown Hayward, Cal State East Bay, and Mission Blvd for easy commuter access. Great opportunity.
For sale
$749,000
24562 Sybil Ave, Hayward, CA 94542
--beds
--baths
2,579sqft
Multi Family
Built in 1920
-- sqft lot
$736,000 Zestimate®
$290/sqft
$-- HOA
What's special
- 4 days
- 183
- 27
Zillow last checked:
Listing updated:
Listed by:
Suzanne Rocha DRE #01787814 925-858-9358,
Cal Home
Source: CCAR,MLS#: 41152939
Facts & features
Interior
Heating
- Wall Furnace
Cooling
- No Air Conditioning
Appliances
- Included: Gas Water Heater
Features
- Flooring: Hardwood, Carpet
Interior area
- Total structure area: 2,579
- Total interior livable area: 2,579 sqft
Property
Parking
- Parking features: Covered, No Garage
- Has garage: Yes
Lot
- Size: 0.32 Acres
- Features: Level, Yard Space
Details
- Parcel number: 44515012
- Special conditions: Offer As Is
Construction
Type & style
- Home type: MultiFamily
- Property subtype: Multi Family
Materials
- Wood Siding
- Roof: Composition
Condition
- Year built: 1920
Utilities & green energy
- Sewer: Public Sewer
- Water: Public
Community & HOA
Community
- Features: None
- Subdivision: Mission Foothill
HOA
- Has HOA: No
Location
- Region: Hayward
Financial & listing details
- Price per square foot: $290/sqft
- Tax assessed value: $127,772
- Date on market: 11/3/2026
Estimated market value
$736,000
$699,000 - $773,000
$3,260/mo
Price history
| Date | Event | Price |
|---|---|---|
| 11/3/2026 | Listed for sale | $749,000$290/sqft |
Source:  CCAR #41152939 Report a problem | ||
Public tax history
| Year | Property taxes | Tax assessment |
|---|---|---|
| 2026 | -- | $127,772 +2% |
| 2025 | $3,094 -24.4% | $125,267 +2% |
| 2024 | $4,095 +92.1% | $122,811 +2% |
| 2023 | $2,132 +1.8% | $120,403 +2% |
| 2022 | $2,095 +1.1% | $118,042 +2% |
| 2021 | $2,072 +0.9% | $115,728 +1% |
| 2020 | $2,054 -0.4% | $114,541 +2% |
| 2019 | $2,062 +6.6% | $112,296 +2% |
| 2018 | $1,934 | $110,094 +2% |
| 2017 | $1,934 +6.2% | $107,935 +2% |
| 2016 | $1,822 +5.2% | $105,819 +1.5% |
| 2015 | $1,731 | $104,230 +2% |
| 2014 | $1,731 | $102,188 +0.5% |
| 2013 | -- | $101,727 +2% |
| 2012 | -- | $99,733 +2% |
| 2011 | -- | $97,777 +0.8% |
| 2010 | -- | $97,047 -0.2% |
| 2009 | -- | $97,277 +2% |
| 2008 | -- | $95,370 +2% |
| 2007 | -- | $93,500 +2% |
| 2006 | -- | $91,667 +2% |
| 2005 | -- | $89,870 +2% |
| 2004 | -- | $88,109 +1.9% |
| 2003 | -- | $86,495 +2% |
| 2002 | -- | $84,799 +2% |
| 2001 | $1,117 | $83,136 |
Find assessor info on the county website
Monthly payment
Est. payment
Payment breakdown
Explore the cost of this home by adjusting the details. Changes won't be saved.Climate risks
Neighborhood: Mission-Foothill


Similar homes
- $898,0004 bd4 ba2.3k sqft1390 Highland Blvd, Hayward, CA 94542For Sale
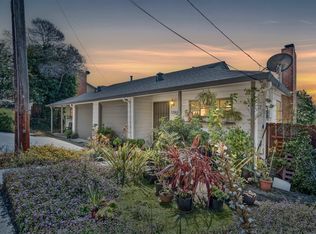 MLS ID #41138441, Darryl Glass. bridgeMLS/CCAR/Bay East AOR
- $768,0005 bd2 ba2k sqft16829 Daryl Ave, San Lorenzo, CA 94580For Sale
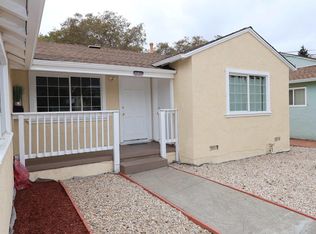 MLS ID #41152851, Sameh Kedes. Bay East AOR
- $789,0004 bd5 ba2.9k sqft2493 Warren Rd, Walnut Creek, CA 94595For Sale
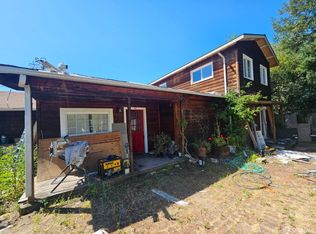 MLS ID #426174684, Sean Scott Day DRE #02208137, Intero Burlingame. SFAR
- $775,0005 bd2 ba1.8k sqft6256 Hayes Street, Oakland, CA 94621For Sale
 MLS ID #326090813, Kelli A Kelly, eXp Realty of California, Inc. BAREIS
