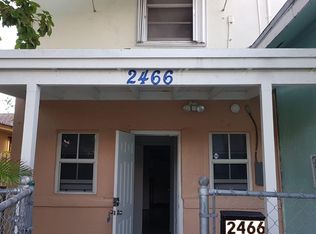
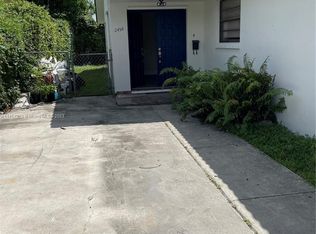
PRIME INVESTMENT OPPORTUNITY | EXCELLENT SHENANDOAH DUPLEX Rare opportunity to own a spacious, fully renovated duplex (late 2023) in Miami’s highly desirable Shenandoah neighborhood, just minutes from Brickell, Coral Gables, and Little Havana. This income-producing property generates $6,400 per month ($76,800 annually) from two rental units, including a spacious 4-bedroom, 2-bath residence. Both units are rented month-to-month, offering investors flexibility to optimize rental income or accommodate future plans. Ideally situated in a prime central Miami location, this recently renovated property combines strong existing rental income, long-term appreciation potential, and exceptional versatility. Competitively priced for a timely sale.
For sale
$1,088,000
2460 SW 16th St, Miami, FL 33145
--beds
--baths
3,104sqft
Duplex
Built in 1986
-- sqft lot
$-- Zestimate®
$351/sqft
$-- HOA
What's special
Recently renovated propertySpacious fully renovated duplex
- 8 days
- 168
- 3
Likely to sell faster than
Zillow last checked:
Listing updated:
Listed by:
Margarita Elordi 305-984-0991,
Core International Realty
Source: MIAMI,MLS#: A12113181 Originating MLS: A-Miami Association of REALTORS
Facts & features
Interior
Heating
- Central, Electric
Cooling
- Central Air, Electric
Features
- Flooring: Ceramic Tile
Interior area
- Total structure area: 3,294
- Total interior livable area: 3,104 sqft
Video & virtual tour
Property
Parking
- Total spaces: 8
Features
- Stories: 1
Lot
- Features: Less Than 1/4 Acre Lot
Details
- Parcel number: 0141100021360
- Zoning: 5700
Construction
Type & style
- Home type: MultiFamily
- Property subtype: Duplex
Materials
- CBS Construction
- Roof: Flat Tile
Condition
- Year built: 1986
Utilities & green energy
- Sewer: Public Sewer
Community & HOA
Community
- Subdivision: Grapeland
HOA
- Has HOA: No
Location
- Region: Miami
Financial & listing details
- Price per square foot: $351/sqft
- Tax assessed value: $843,520
- Annual tax amount: $16,641
- Date on market: 11/5/2026
- Listing terms: All Cash,Conventional
Estimated market value
Not available
Estimated sales range
Not available
Not available
Price history
| Date | Event | Price |
|---|---|---|
| 11/5/2026 | Listed for sale | $1,088,000+42.2%$351/sqft |
Source:  MIAMI #A12113181 Report a problem | ||
| 11/28/2023 | Listing removed | -- |
Source: MIAMI #A11458035 Report a problem | ||
| 11/21/2023 | Price change | $3,280-5.7%$1/sqft |
Source: MIAMI #A11458035 Report a problem | ||
| 11/8/2023 | Price change | $3,480-2.8%$1/sqft |
Source: MIAMI #A11458035 Report a problem | ||
| 10/2/2023 | Price change | $3,580-0.6%$1/sqft |
Source: MIAMI #A11458035 Report a problem | ||
| 9/24/2023 | Listed for rent | $3,600$1/sqft |
Source: MIAMI #A11458035 Report a problem | ||
| 8/1/2023 | Sold | $765,000-16.8%$246/sqft |
Source: MIAMI #A11264622 Report a problem | ||
| 5/1/2023 | Pending sale | $920,000$296/sqft |
Source: MIAMI #A11264622 Report a problem | ||
| 3/28/2023 | Listed for sale | $920,000$296/sqft |
Source: MIAMI #A11264622 Report a problem | ||
| 3/14/2023 | Pending sale | $920,000$296/sqft |
Source: MIAMI #A11264622 Report a problem | ||
| 9/22/2022 | Price change | $920,000-5.2%$296/sqft |
Source: MIAMI #A11264622 Report a problem | ||
| 8/29/2022 | Listed for sale | $970,000+70.2%$313/sqft |
Source: MIAMI #A11264622 Report a problem | ||
| 11/1/2006 | Sold | $570,000$184/sqft |
Source: Public Record Report a problem | ||
Public tax history
| Year | Property taxes | Tax assessment |
|---|---|---|
| 2025 | $16,641 +12.5% | $770,237 +10% |
| 2024 | $14,788 +20.4% | $700,216 +35.5% |
| 2023 | $12,285 +11.3% | $516,803 +10% |
| 2022 | $11,035 +9.4% | $469,821 +10% |
| 2021 | $10,084 +5.4% | $427,110 +10% |
| 2020 | $9,570 +8.9% | $388,282 +10% |
| 2019 | $8,789 +11.3% | $352,984 +10% |
| 2018 | $7,899 | $320,895 +10% |
| 2017 | $7,899 +9.2% | $291,723 +10% |
| 2016 | $7,234 +18.2% | $265,203 +10% |
| 2015 | $6,121 +0.2% | $241,094 +3% |
| 2014 | $6,108 +19.1% | $234,023 +10% |
| 2013 | $5,130 | $212,749 +10% |
| 2012 | $5,130 -23.4% | $193,409 -21.2% |
| 2010 | $6,700 -33.3% | $245,385 -39.4% |
| 2009 | $10,042 -16.8% | $404,989 -21.5% |
| 2007 | $12,075 +26.1% | $515,674 |
| 2006 | $9,573 | -- |
| 2005 | $9,573 +25.4% | -- |
| 2004 | $7,632 +20.9% | -- |
| 2003 | $6,311 +17.9% | -- |
| 2002 | $5,352 | -- |
| 2001 | $5,352 | -- |
Find assessor info on the county website
Monthly payment
Est. payment
Payment breakdown
Explore the cost of this home by adjusting the details. Changes won't be saved.Climate risks
Neighborhood: Coral Way

Similar homes
- $1,200,0003 bd3 ba1.9k sqftCitrus Park, Miami, FL 33135For Sale

 MLS ID #A12081357, Maria Marianeschi, Binter Real Estate. MIAMI
- $889,0003 bd2 ba1.5k sqftDurniers, Miami, FL 33145For Sale
 MLS ID #A12101582, Gianni Perocarpi, Coldwell Banker Realty. MIAMI
- $1,050,0006 bd4 ba2.3k sqftDual Condo No 1, Miami, FL 33155For Sale
 MLS ID #A12074937, James Byrd, Coldwell Banker Realty. MIAMI
- $1,200,0004 bd4 ba2.4k sqftAlta Terra, South Miami, FL 33155For Sale
 MLS ID #A12090321, Sofia Giraldo, Compass Florida, LLC. MIAMI
- $1,150,0004 bd3 ba1.9k sqftGlenroyal Sub, Miami, FL 33125For SaleMLS ID #A12042124, Arnold Miranda, Lexan Real Estate, LLC. MIAMI
- $1,250,0005 bd7 ba3.3k sqftWaldin Acres, Miami, FL 33125For SaleMLS ID #A11958845, Michelle Real, Avenuewest Miami. MIAMI
- $595,9006 bd3 ba1.7k sqft17th Ave Manor 2nd Addn, Miami, FL 33142For SaleMLS ID #A12119971, Idalia Nunez, London Foster Realty. MIAMI
- $1,095,0005 bd4 ba2.3k sqftDarlington Manor, Miami, FL 33173For SaleMLS ID #A12074166, Gino Torrente, Fortune Christie's Intl R.E.. MIAMI
- $975,0008 bd5 ba2.2k sqftBuena Vista Gardens, Miami, FL 33127For SaleMLS ID #A12088467, Marsha Edwards, LoKation. MIAMI
- $960,0004 bd4 ba1.5k sqftWynd Wood Park, Miami, FL 33127For SaleMLS ID #A11711586, Sherry Lebowitz, Lifestyle International Realty. MIAMI
- $1,430,0004 bd4 ba1.8k sqft907 MONTEREY Street, Coral Gables, FL 33134For Sale
 MLS ID #B26098869, Jorge A Zea, Blue Lighthouse Realty, INC. BeachesMLS
- $599,0005 bd2 ba1.6k sqftGordon Dale Pk, Miami, FL 33150For SaleMLS ID #A12109914, Jorge Andrade PA, Compass Florida, LLC. MIAMI
- $769,0003 bd2 ba1.7k sqftBoscoble, Miami, FL 33135For SaleMLS ID #A12091422, Magaly Romero, The Keyes Company. MIAMI
- $1,195,0004 bd2 ba1.6k sqftBiltmore Sub, Miami, FL 33137For SaleMLS ID #A11987182, Lucia Hermoso, Coldwell Banker Realty. MIAMI
- $920,0004 bd3 ba1.6k sqftAlta Vista, Miami, FL 33127For SaleMLS ID #A12057382, Hugo Lopez Diaz, My Realty Group, LLC.. MIAMI
- $925,0003 bd2 ba1.7k sqftLe Jeune Villas, Miami, FL 33134For SaleMLS ID #A12102774, Alberto Calil, Esquire Real Estate Serv.. MIAMI
- $895,0004 bd2 ba2.2k sqftKendale South Sec 2 Part, Miami, FL 33176For SaleMLS ID #A12117360, Robert Morales, Florida Realty of Miami Corp. MIAMI
- $749,9004 bd3 ba1.5k sqftCity Line Park Amd, Miami, FL 33125For SaleMLS ID #A12077984, Ana Zecca, Zecca Realty Group. MIAMI
- $840,0006 bd4 ba2.9k sqftMajorca Estates, Miami Gardens, FL 33169For SaleMLS ID #A12119533, Ricky Kallabat PA, Keller Williams Capital Realty. MIAMI
- $1,299,0007 bd6 ba3k sqftSusan Gardens, Hialeah, FL 33013For SaleMLS ID #A11631258, Joshua Mendoza, JM & Associates Realty Inc. MIAMI
