Welcome to the quaint seaside community of Stendahl. Abutting the Popponesset Marketplace,across the street from the Popponesset Inn and 1 mile down Shore Drive to the beautiful peninsula beach known as The " Spit". This unit is at the very back of the complex,free from the foot traffic and any passing cars. Enjoy the peace and quiet as well as privacy. Fully furnished and ready to go. Enjoy as a primary residence,a weekend getaway or a lucrative short term rental .
For sale
$465,000
251 Shore Drive #G2, Mashpee, MA 02649
2beds
624sqft
Condominium
Built in 1965
-- sqft lot
$-- Zestimate®
$745/sqft
$525/mo HOA
What's special
- 12 days
- 550
- 16
Zillow last checked:
Listing updated:
Listed by:
David L White 617-542-9300,
OwnerEntry.com
Source: CCIMLS,MLS#: 22605348
Facts & features
Interior
Bedrooms & bathrooms
- Bedrooms: 2
- Bathrooms: 1
- Full bathrooms: 1
Heating
- Natural Gas
Appliances
- Included: Microwave, Electric Range, Refrigerator, Washer, Water Heater
- Laundry: Electric Dryer
Features
- Flooring: Hardwood
Interior area
- Total structure area: 624
- Total interior livable area: 624 sqft
Property
Features
- Stories: 1
- Patio & porch: Deck, Patio
Details
- Parcel number: 123170G2
- Special conditions: Entry Only/Limited Service
Construction
Type & style
- Home type: Condo
- Property subtype: Condominium
Condition
- Year built: 1965
Utilities & green energy
- Water: Public
Community & HOA
HOA
- Has HOA: Yes
- Amenities included: Landscaping, Snow Removal
- Services included: Flood Insurance, Sewer, Water
- HOA fee: $525 monthly
Location
- Region: Mashpee
Financial & listing details
- Price per square foot: $745/sqft
- Tax assessed value: $350,400
- Annual tax amount: $2,303
- Date on market: 10/20/2026
- Cumulative days on market: 13 days
- Ownership: Condo
Estimated market value
Not available
Estimated sales range
Not available
Not available
Price history
| Date | Event | Price |
|---|---|---|
| 10/20/2026 | Listed for sale | $465,000-3.1%$745/sqft |
Source:  CCIMLS #22605348 Report a problem | ||
| 9/2/2025 | Listing removed | $480,000$769/sqft |
Source: MLS PIN #73358598 Report a problem | ||
| 8/24/2025 | Price change | $480,000-4%$769/sqft |
Source: MLS PIN #73358598 Report a problem | ||
| 4/11/2025 | Listed for sale | $499,900+28.2%$801/sqft |
Source: MLS PIN #73358598 Report a problem | ||
| 3/14/2023 | Sold | $390,000-1.3%$625/sqft |
Source: MLS PIN #73072789 Report a problem | ||
| 1/25/2023 | Contingent | $395,000$633/sqft |
Source: MLS PIN #73072789 Report a problem | ||
| 1/25/2023 | Pending sale | $395,000$633/sqft |
Source: CCIMLS #22300200 Report a problem | ||
| 1/23/2023 | Listed for sale | $395,000+79.5%$633/sqft |
Source: MLS PIN #73072789 Report a problem | ||
| 11/10/2020 | Sold | $220,000-12%$353/sqft |
Source: CCIMLS #22006769 Report a problem | ||
| 10/25/2020 | Pending sale | $249,900$400/sqft |
Source: Keller Williams Elite #72714258 Report a problem | ||
| 10/14/2020 | Price change | $249,900-7.1%$400/sqft |
Source: Keller Williams Elite #72714258 Report a problem | ||
| 10/8/2020 | Pending sale | $269,000$431/sqft |
Source: Keller Williams Elite #72714258 Report a problem | ||
| 9/22/2020 | Price change | $269,000-6.9%$431/sqft |
Source: Keller Williams Elite #72714258 Report a problem | ||
| 8/22/2020 | Listed for sale | $289,000+197.9%$463/sqft |
Source: Keller Williams Elite #72714258 Report a problem | ||
| 11/15/1999 | Sold | $97,000+22.8%$155/sqft |
Source: Public Record Report a problem | ||
| 5/31/1995 | Sold | $79,000$127/sqft |
Source: Public Record Report a problem | ||
Public tax history
| Year | Property taxes | Tax assessment |
|---|---|---|
| 2025 | $2,320 +8.1% | $350,400 +4.9% |
| 2024 | $2,147 +11.9% | $333,900 +22% |
| 2023 | $1,919 +5.3% | $273,700 +22.7% |
| 2022 | $1,822 -1% | $223,000 +9.9% |
| 2021 | $1,841 +13.2% | $203,000 +13.5% |
| 2020 | $1,626 +4.4% | $178,900 +4% |
| 2019 | $1,558 +4.5% | $172,100 +2.9% |
| 2018 | $1,491 -0.1% | $167,200 +3% |
| 2017 | $1,492 +1.9% | $162,400 +2.5% |
| 2016 | $1,464 -1.9% | $158,400 -3.4% |
| 2015 | $1,493 -4.2% | $163,900 -1.3% |
| 2014 | $1,559 -0.1% | $166,000 -1.3% |
| 2013 | $1,561 +7.6% | $168,200 +3.9% |
| 2012 | $1,451 -1.8% | $161,900 -3.2% |
| 2011 | $1,477 +2.4% | $167,300 -9.7% |
| 2010 | $1,443 -2.7% | $185,300 -12.7% |
| 2009 | $1,483 +6.2% | $212,200 |
| 2008 | $1,396 +3.6% | $212,200 -8.1% |
| 2007 | $1,348 | $230,800 |
Find assessor info on the county website
Monthly payment
Est. payment
Payment breakdown
Explore the cost of this home by adjusting the details. Changes won't be saved.Climate risks
Neighborhood: 02649

Similar homes
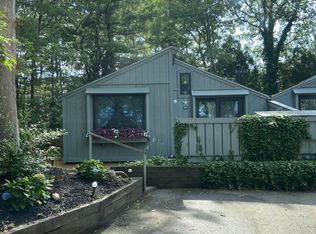
- $339,0002 bd1 ba432 sqft273 Main St, Mashpee, MA 02649For Sale
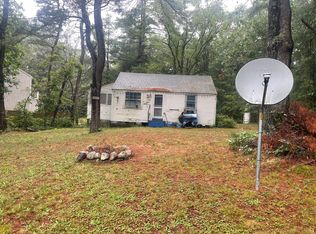 MLS ID #73597029, Michael Connor, Connor Real Estate. MLS PIN
- $685,0002 bd2 ba810 sqft33 Landmark Avenue, Mashpee, MA 02649For Sale

 MLS ID #22604421, Thalia J Logan, New Seabury Sotheby's International Realty. CCIMLS
- $685,0002 bd2 ba810 sqftMaushop Village, Mashpee, MA 02649For Sale
 MLS ID #73575839, Thalia Logan, New Seabury Sotheby's International Realty. MLS PIN
- $274,9002 bd1 ba864 sqft70 Cape Dr APT 7D, Mashpee, MA 02649For Sale
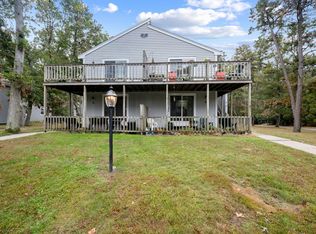 MLS ID #73593337, Michael Vaz, Century 21 Signature Properties. MLS PIN
- $499,0002 bd1 ba576 sqft10 Atwater Drive, East Falmouth, MA 02536For SaleMLS ID #22605086, Lee K Cloutier, Kinlin Grover Compass. CCIMLS
- $449,9002 bd1 ba768 sqft17 Sioux Road, West Yarmouth, MA 02673For SaleMLS ID #22605513, Susan E Contonio, McPhee Associates Realty. CCIMLS
- $319,9002 bd1 ba864 sqft35 Ashumet Road #10A, Mashpee, MA 02649For SaleMLS ID #22604410, Leighton Team, Keller Williams Realty. CCIMLS
- $439,0002 bd1 ba912 sqft123 Elain Avenue, East Falmouth, MA 02536For SaleMLS ID #22604332, Michael Harney, Sotheby's International Realty. CCIMLS
- $269,0002 bd1 ba864 sqft70 Cape Drive APT 1D, Mashpee, MA 02649For SaleMLS ID #22603948, Adrienne G Siegel, Strawberry Hill R E. CCIMLS
- $449,0002 bd1 ba561 sqft36 Alden Way, Hyannis, MA 02601For SaleMLS ID #22605486, Ken Hager, Classic Cape Real Estate, LLC. CCIMLS
- $449,9001 bd1 ba560 sqft87 Acapesket Road #2B, East Falmouth, MA 02536New ConstructionMLS ID #22601408, Daniel Kelleher, Keller Williams Elite. CCIMLS
- $435,0002 bd1 ba580 sqft19 Tevyaw Road, Hyannis, MA 02601For SaleMLS ID #22605349, Nile A Morin, Oceanside Realty Group. CCIMLS
- $600,0003 bd1 ba888 sqft28 Avalon Drive, East Falmouth, MA 02536For SaleMLS ID #22605320, Kerry Houde, Lamacchia Realty, Inc.. CCIMLS
- $515,0002 bd1 ba888 sqft50 Shallow Brook Road, South Yarmouth, MA 02664For SaleMLS ID #22605359, Ned B Chatelain, Chatelain Real Estate. CCIMLS
- $389,0001 bd2 ba590 sqft21 Island Inn Road UNIT 38 G, Oak Bluffs, MA 02557For SaleMLS ID #22604260, Rene' A Ben David, Ocean Park Realty, Inc.. CCIMLS
- $294,5002 bd1 ba864 sqft70 Cape Drive APT 8B, Mashpee, MA 02649For SaleMLS ID #22602713, Leanne Bocchetti, Compass Massachusetts, LLC. CCIMLS
