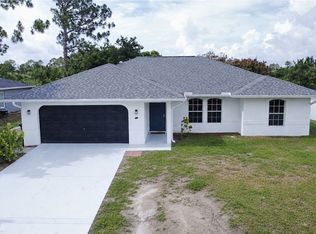
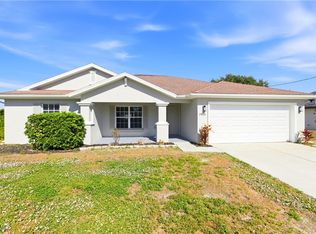
This 1414 square foot single family home has 3 bedrooms and 2.0 bathrooms. This home is located at 2515 39th St SW, Lehigh Acres, FL 33976.
Pre-foreclosure
Street View
Est. $262,600
2515 39th St SW, Lehigh Acres, FL 33976
3beds
2baths
1,414sqft
SingleFamily
Built in 2005
0.25 Acres Lot
$262,600 Zestimate®
$186/sqft
$-- HOA
Overview
- 170 days |
- 5 |
- 0 |
Facts & features
Interior
Bedrooms & bathrooms
- Bedrooms: 3
- Bathrooms: 2
Heating
- Forced air
Cooling
- Central
Features
- Flooring: Other, Carpet
Interior area
- Total interior livable area: 1,414 sqft
Property
Parking
- Parking features: Garage - Attached
Features
- Exterior features: Stucco
Lot
- Size: 0.25 Acres
Details
- Parcel number: 124526L2111120020
Construction
Type & style
- Home type: SingleFamily
Materials
- Roof: Asphalt
Condition
- Year built: 2005
Community & HOA
Location
- Region: Lehigh Acres
Financial & listing details
- Price per square foot: $186/sqft
- Tax assessed value: $208,325
- Annual tax amount: $1,235
Visit our professional directory to find a foreclosure specialist in your area that can help with your home search.
Find a foreclosure agentForeclosure details
Estimated market value
$262,600
$242,000 - $281,000
$1,812/mo
Price history
| Date | Event | Price |
|---|---|---|
| 6/10/2005 | Sold | $148,300+3802.6%$105/sqft |
Source: Public Record Report a problem | ||
| 11/12/2003 | Sold | $3,800$3/sqft |
Source: Public Record Report a problem | ||
Public tax history
| Year | Property taxes | Tax assessment |
|---|---|---|
| 2025 | $1,235 +5.2% | $69,461 +2.9% |
| 2024 | $1,174 +9.7% | $67,503 +3% |
| 2023 | $1,070 +2.4% | $65,537 +3.8% |
| 2022 | $1,045 +7.5% | $63,128 |
| 2021 | $972 +0.6% | -- |
| 2020 | $966 +13.7% | $60,922 -55.9% |
| 2019 | $850 | $138,081 +136.3% |
| 2018 | $850 +3% | $58,442 +2.1% |
| 2017 | $825 +4.9% | $57,240 -42% |
| 2016 | $786 +3.6% | $98,643 +12.7% |
| 2015 | $759 +0.2% | $87,495 +19.7% |
| 2014 | $757 +24.3% | $73,101 +17.5% |
| 2013 | $609 +1.9% | $62,214 +16.3% |
| 2012 | $598 -2.7% | $53,505 +0.9% |
| 2011 | $615 -4.3% | $53,018 -0.7% |
| 2010 | $642 -15.9% | $53,367 -17.1% |
| 2009 | $764 -63% | $64,340 -58% |
| 2008 | $2,065 -26.1% | $153,290 -21.3% |
| 2007 | $2,794 +0.8% | $194,840 +11.3% |
| 2006 | $2,774 +3164.5% | $175,010 +5047.4% |
| 2004 | $85 +77% | $3,400 +161.5% |
| 2003 | $48 -9.5% | $1,300 -13.3% |
| 2002 | $53 | $1,500 +25% |
| 2000 | -- | $1,200 |
Find assessor info on the county website
Monthly payment
Estimated monthly payment$1,822
All calculations are estimates and provided by Zillow, Inc. for informational purposes only. Actual amounts may vary.
HOA fees may include property taxes on listings classified as Co-Ops. Contact the listing agent and/or owner for fee details.
Mortgage interest rates are dependent on a number of factors, including credit score, down payment, and repayment length. Interest rate data provided by Zillow Group Marketplace, Inc. as of 1/1/1970 from various mortgage lenders with which we have lead or other similar arrangements; the Estimated Payment is an average of those rates.
See how much you could borrow to make a competitive offer.
Climate risks
Neighborhood: 33976
Nearby schools
GreatSchools rating
- 4/10Veterans Park Academy For The ArtsGrades: PK-8Distance: 2.3 mi
- 2/10East Lee County High SchoolGrades: 9-12Distance: 3.9 mi
- 3/10G. Weaver Hipps Elementary SchoolGrades: PK-5Distance: 2.4 mi


- Florida
- Lee County
- Lehigh Acres
- 33976
- 2515 39th St SW
Nearby cities
Nearby zip codes
Other Lehigh Acres Topics
