Perfect starter home or investment opportunity! This 3 bedroom, 1 bathroom home is move in ready and is waiting for it's new owners! Located in the heart of Baton Rouge and near Southern University campus, an opportunity like this does not arise often. No flood insurance required! Schedule your private showing today.
For sale
Price cut: $5K (9/29)
$94,900
2547 73rd Ave, Baton Rouge, LA 70807
3beds
1,067sqft
Single Family Residence
Built in 1975
435 Square Feet Lot
$-- Zestimate®
$89/sqft
$-- HOA
What's special
- 261 days
- 96
- 10
Zillow last checked:
Listing updated:
Listed by:
Jeremy Henderson,
Keller Williams Realty-First Choice 225-744-0044
Source: ROAM MLS,MLS#: 2026003166
Facts & features
Interior
Bedrooms & bathrooms
- Bedrooms: 3
- Bathrooms: 1
- Full bathrooms: 1
Primary bedroom
- Level: First
- Area: 121 Square Feet
- Dimensions: 11x11
Bedroom
- Level: First
- Area: 121 Square Feet
- Dimensions: 11x11
Bedroom
- Level: First
- Area: 121 Square Feet
- Dimensions: 11x11
Heating
- Central
Cooling
- Central Air
Interior area
- Total structure area: 1,307
- Total interior livable area: 1,067 sqft
Property
Parking
- Parking features: Driveway, Covered
- Has uncovered spaces: Yes
Features
- Levels: One
- Stories: 1
Lot
- Size: 435 Square Feet
- Dimensions: 54.6 x 110
Details
- Parcel number: 445037
Construction
Type & style
- Home type: SingleFamily
- Architectural style: Traditional
- Property subtype: Single Family Residence
Materials
- Brick, Wood Siding
- Foundation: Slab
Condition
- Year built: 1975
Utilities & green energy
- Sewer: Public Sewer
- Water: Public
Community & HOA
Community
- Subdivision: Woodaire
HOA
- Has HOA: No
Location
- Region: Baton Rouge
Financial & listing details
- Price per square foot: $89/sqft
- Tax assessed value: $75,900
- Annual tax amount: $931
- Date on market: 2/20/2026
- Listing terms: Cash,Conventional,FHA,USDA Loan,VA Loan,Submit
Estimated market value
Not available
Estimated sales range
Not available
Not available
Price history
| Date | Event | Price |
|---|---|---|
| 9/29/2026 | Price change | $94,900-5%$89/sqft |
Source:  ROAM MLS #2026003166 Report a problem | ||
| 9/22/2026 | Price change | $99,900-3.8%$94/sqft |
Source: ROAM MLS #2026003166 Report a problem | ||
| 9/18/2026 | Price change | $103,900+0.1%$97/sqft |
Source: ROAM MLS #2026003166 Report a problem | ||
| 8/25/2026 | Price change | $103,800-0.1%$97/sqft |
Source: ROAM MLS #2026003166 Report a problem | ||
| 7/24/2026 | Price change | $103,900-5.3%$97/sqft |
Source: ROAM MLS #2026003166 Report a problem | ||
| 6/13/2026 | Price change | $109,700-0.1%$103/sqft |
Source: ROAM MLS #2026003166 Report a problem | ||
| 6/6/2026 | Price change | $109,800-0.1%$103/sqft |
Source: ROAM MLS #2026003166 Report a problem | ||
| 5/17/2026 | Price change | $109,900-0.1%$103/sqft |
Source: ROAM MLS #2026003166 Report a problem | ||
| 2/20/2026 | Listed for sale | $110,000+37.8%$103/sqft |
Source: ROAM MLS #2026003166 Report a problem | ||
| 10/20/2023 | Listing removed | -- |
Source: Zillow Rentals Report a problem | ||
| 10/15/2023 | Listed for rent | $1,250$1/sqft |
Source: Zillow Rentals Report a problem | ||
| 7/19/2023 | Sold | -- |
Source: ROAM MLS #2022010427 Report a problem | ||
| 6/20/2023 | Pending sale | $79,800$75/sqft |
Source: ROAM MLS #2022010427 Report a problem | ||
| 6/13/2023 | Price change | $79,800-0.1%$75/sqft |
Source: ROAM MLS #2022010427 Report a problem | ||
| 5/28/2023 | Price change | $79,900+0.1%$75/sqft |
Source: ROAM MLS #2022010427 Report a problem | ||
| 5/22/2023 | Price change | $79,800-0.1%$75/sqft |
Source: ROAM MLS #2022010427 Report a problem | ||
| 5/11/2023 | Price change | $79,900-3.2%$75/sqft |
Source: ROAM MLS #2022010427 Report a problem | ||
| 4/15/2023 | Price change | $82,500-2.8%$77/sqft |
Source: ROAM MLS #2022010427 Report a problem | ||
| 3/14/2023 | Listed for sale | $84,900$80/sqft |
Source: ROAM MLS #2022010427 Report a problem | ||
| 2/21/2023 | Pending sale | $84,900$80/sqft |
Source: ROAM MLS #2022010427 Report a problem | ||
| 2/4/2023 | Price change | $84,900-0.1%$80/sqft |
Source: ROAM MLS #2022010427 Report a problem | ||
| 12/29/2022 | Price change | $85,000-5.3%$80/sqft |
Source: ROAM MLS #2022010427 Report a problem | ||
| 12/13/2022 | Price change | $89,800-0.1%$84/sqft |
Source: ROAM MLS #2022010427 Report a problem | ||
| 10/20/2022 | Listed for sale | $89,900$84/sqft |
Source: ROAM MLS #2022010427 Report a problem | ||
| 10/9/2022 | Pending sale | $89,900$84/sqft |
Source: ROAM MLS #2022010427 Report a problem | ||
| 9/27/2022 | Listed for sale | $89,900$84/sqft |
Source: ROAM MLS #2022010427 Report a problem | ||
Public tax history
| Year | Property taxes | Tax assessment |
|---|---|---|
| 2025 | $931 +4.7% | $7,590 |
| 2024 | $889 +195% | $7,590 +200% |
| 2023 | $301 -0.2% | $2,530 |
| 2022 | $302 +2.4% | $2,530 |
| 2021 | $295 +0.2% | $2,530 |
| 2020 | $295 +5.8% | $2,530 +10% |
| 2019 | $279 +1.3% | $2,300 |
| 2018 | $275 | $2,300 |
| 2017 | $275 | $2,300 |
| 2016 | $275 +2.5% | $2,300 +2.2% |
| 2015 | $268 +808.5% | $2,250 |
| 2014 | $30 | $2,250 |
| 2013 | $30 -88.7% | $2,250 |
| 2012 | $262 +8.8% | $2,250 |
| 2011 | $241 +0% | $2,250 |
| 2010 | $241 +696.7% | $2,250 |
| 2009 | $30 | $2,250 |
| 2008 | $30 +1.4% | $2,250 +4.7% |
| 2007 | $30 | $2,150 |
| 2006 | $30 +0% | $2,150 |
| 2005 | $30 +0% | $2,150 |
| 2004 | $30 -9.8% | $2,150 -6.5% |
| 2003 | $33 0% | $2,300 |
| 2002 | $33 | $2,300 |
| 2001 | $33 +71.9% | $2,300 |
| 2000 | $19 | $2,300 |
Find assessor info on the county website
Monthly payment
Est. payment
Payment breakdown
Explore the cost of this home by adjusting the details. Changes won't be saved.Climate risks
Neighborhood: Scotlandville
Similar homes
- $93,0003 bd2 ba1.3k sqft3285 Ozark St, Baton Rouge, LA 70805For Sale
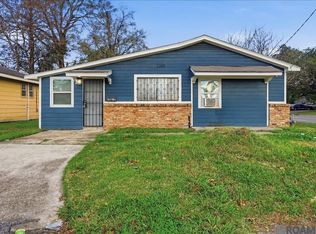
 MLS ID #2026018708, Darren James, LPT Realty, LLC. ROAM MLS
- $80,0002 bd2 ba982 sqft2755 Tanner St, Baton Rouge, LA 70807For Sale
 MLS ID #2026018150, Beatriz Adcox, David Landry Real Estate, LLC. ROAM MLS
- $109,9003 bd1 ba915 sqft2857 Weller Ave, Baton Rouge, LA 70805For Sale
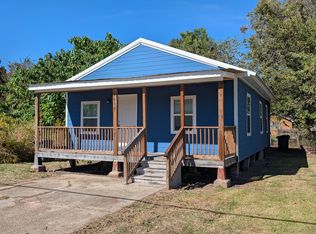 MLS ID #200MWT, Larry Clark, LPT Realty, LLC. ROAM MLS
- $89,9003 bd1 ba1k sqft3923 Shelley St, Baton Rouge, LA 70805For Sale
 MLS ID #2026015926, Tara Lewis, Better Homes and Gardens Real Estate - Tiger Town BR. ROAM MLS
- $88,0003 bd1 ba1k sqft1600 N 23rd St, Baton Rouge, LA 70802For SaleMLS ID #2026019279, Blanca Ruiz, Goodwood Realty. ROAM MLS
- $124,9003 bd3 ba1.2k sqft5344 Peerless St, Baton Rouge, LA 70811For SaleMLS ID #2026019137, Ericka Queen, Keller Williams Realty Red Stick Partners. ROAM MLS
- $114,9003 bd2 ba1k sqft4002 Accardo St, Baker, LA 70805For SaleMLS ID #2026006707, Megan Donaldson, Dixon Realty. ROAM MLS
- $120,0003 bd2 ba1.2k sqft6562 Perimeter Dr, Baton Rouge, LA 70812For SaleMLS ID #2026016133, Joanna Arnold, Keller Williams Realty Red Stick Partners. ROAM MLS
- $99,0003 bd2 ba1.1k sqft1132 Oregon Ave, Port Allen, LA 70767For SaleMLS ID #2026011098, Darren James, LPT Realty, LLC. ROAM MLS
- $73,0003 bd1 ba1k sqft5974 Byron St, Baton Rouge, LA 70805For SaleMLS ID #2026014013, Shannon LeBlanc, 1% Lists Acadiana. ROAM MLS
- $120,0003 bd2 ba1.1k sqft2855 Elgin St, Baton Rouge, LA 70805For SaleMLS ID #2026008333, LaShonda Pitts, Goodwood Realty. ROAM MLS
- $92,0002 bd2 ba1k sqft1738 Brightside Dr APT C, Baton Rouge, LA 70820For SaleMLS ID #200MSP, Stephanie Clarke, Summit Realtors, LLC. ROAM MLS
- $65,0002 bd1 ba1.3k sqft4239 Delaware St, Baton Rouge, LA 70805For SaleMLS ID #2026017245, LaRhonda Thomas, Keller Williams Realty-First Choice. ROAM MLS
- $63,5003 bd1 ba1.1k sqft4433 Sherwood St, Baton Rouge, LA 70805For SaleMLS ID #2026005859, Jonah Mumphrey, Pivot Realty. ROAM MLS
- $119,9003 bd2 ba1k sqft5776 Atlanta Ave, Baton Rouge, LA 70812For SaleMLS ID #2026012479, Gaylord Bell, Lacy Baaheth, LLC. ROAM MLS
- $78,5003 bd1 ba1.3k sqft2604 Jackson Ave, Baton Rouge, LA 70802For SaleMLS ID #2026001111, Evelyn Greenwood, Fathom Realty LA LLC. ROAM MLS
- $104,9952 bd1 ba919 sqft1109 Thomas H Delpit Dr, Baton Rouge, LA 70802For SaleMLS ID #2026006149, Brandon Dumas, Compass Real Estate Group of Louisiana, LLC. ROAM MLS
- $90,0002 bd2 ba956 sqft4735 Government St APT 222, Baton Rouge, LA 70806For SaleMLS ID #2026008898, Shannon Guglielmo, Keller Williams Realty-First Choice. ROAM MLS
- $59,9004 bd1 ba1.1k sqft5044 Enterprise St, Baton Rouge, LA 70805For SaleMLS ID #2025022101, Tosh Major, Major Agency. ROAM MLS
- $55,9002 bd2 ba756 sqft1247 N 37th St, Baton Rouge, LA 70802For SaleMLS ID #2026015225, LaRhonda Thomas, Keller Williams Realty-First Choice. ROAM MLS
