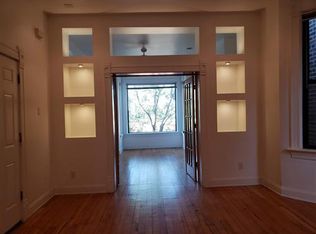
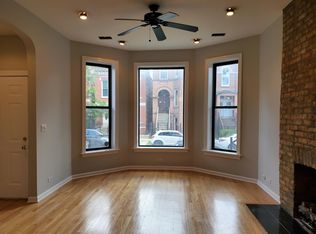
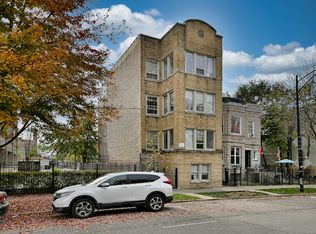
Great 3 flat investment opportunity in highly desirable West Town location. Well maintained and updated brick beauty with two 3-bedroom, 2-bathroom units and one duplexed 4-bedroom, 3-bathroom unit. Central air and heat in each unit. Tenants pay their own utilities. Newer kitchens and baths. HWF throughout (except basement level). Large 2 car garage. 2 of 3 units currently rented, so immediate opportunity for owner occupant scenario. Don't miss this gem!
Active
$1,325,000
2715 W Thomas St, Chicago, IL 60622
10beds
--sqft
Multi Family
Built in ----
-- sqft lot
$-- Zestimate®
$--/sqft
$-- HOA
What's special
Hwf throughoutNewer kitchens and baths
- --
- 346
- views
- 38
- saves
Zillow last checked:
Listing updated:
Listed by:
Barbara Allen 773-698-8380,
Metru Real Estate LLC
Source: MRED as distributed by MLS GRID,MLS#: 12792513
Facts & features
Interior
Bedrooms & bathrooms
- Bedrooms: 10
- Bathrooms: 7
- Full bathrooms: 7
Heating
- Forced Air, Sep Heating Systems - 2+, Indv Controls, Zoned
Appliances
- Included: Humidifier, Electric Water Heater, Gas Water Heater
Features
- Basement: Finished,Full
Property
Parking
- Total spaces: 2
- Parking features: Yes, Garage Owned, Detached, Garage
- Garage spaces: 2
Lot
- Size: 3,100 Square Feet
- Dimensions: 25 X 124
Details
- Parcel number: 16014080230000
- Special conditions: List Broker Must Accompany
- Other equipment: Ceiling Fan(s), Sump Pump
Construction
Type & style
- Home type: MultiFamily
- Property subtype: Multi Family
Materials
- Brick
Condition
- New construction: No
- Major remodel year: 2013
Utilities & green energy
- Sewer: Public Sewer
- Water: Lake Michigan, Public
Green energy
- Energy efficient items: Water Heater
Community & HOA
Community
- Features: Park, Curbs, Sidewalks, Street Lights, Street Paved
- Security: Carbon Monoxide Detector(s)
Location
- Region: Chicago
Financial & listing details
- Tax assessed value: $861,610
- Annual tax amount: $13,720
- Date on market: 10/23/2026
- Ownership: Fee Simple
Estimated market value
Not available
Estimated sales range
Not available
Not available
Price history
| Date | Event | Price |
|---|---|---|
| 10/23/2026 | Listed for sale | $1,325,000+132.5% |
Source:  MRED as distributed by MLS GRID #12792513 Report a problem | ||
| 11/9/2022 | Listed for rent | $1,900 |
Source: Zillow Rental Manager Report a problem | ||
| 11/23/2021 | Listing removed | -- |
Source: Zillow Rental Manager Report a problem | ||
| 10/6/2021 | Price change | $1,900-5% |
Source: Zillow Rental Manager Report a problem | ||
| 8/31/2021 | Listed for rent | $2,000 |
Source: Zillow Rental Manager Report a problem | ||
| 12/11/2012 | Sold | $570,000-8.1% |
Source: MRED as distributed by MLS GRID #08152366 Report a problem | ||
| 9/6/2012 | Listed for sale | $620,000+107.4% |
Source: Organic Realty Report a problem | ||
| 12/29/2010 | Listing removed | $299,000 |
Source: Koenig & Strey Real Living Report a problem | ||
| 10/2/2010 | Price change | $299,000-6.3% |
Source: Koenig & Strey Real Living Report a problem | ||
| 7/29/2010 | Listed for sale | $319,000+72.4% |
Source: Koenig & Strey Real Living Report a problem | ||
| 1/6/2010 | Sold | $185,000-26% |
Source: MRED as distributed by MLS GRID #07375276 Report a problem | ||
| 11/10/2009 | Listed for sale | $249,900+35.1% |
Source: Sergio and Banks #07375276 Report a problem | ||
| 2/17/2009 | Sold | $185,000 |
Source: Public Record Report a problem | ||
Public tax history
| Year | Property taxes | Tax assessment |
|---|---|---|
| 2024 | $17,362 +26.5% | $86,161 +32.9% |
| 2023 | $13,720 -4.5% | $64,831 -7.2% |
| 2022 | $14,363 -1.6% | $69,829 -3.8% |
| 2021 | $14,591 +32.5% | $72,560 +46.8% |
| 2020 | $11,013 -9.7% | $49,435 -18.6% |
| 2019 | $12,201 -8.2% | $60,727 -9.7% |
| 2018 | $13,285 +52.6% | $67,253 +66.3% |
| 2017 | $8,707 -0.9% | $40,445 -7.8% |
| 2016 | $8,787 +9.3% | $43,870 |
| 2015 | $8,039 +19.5% | $43,870 +21% |
| 2014 | $6,726 +2% | $36,249 |
| 2013 | $6,593 +1.4% | $36,249 |
| 2012 | $6,505 -15.1% | $36,249 -23.4% |
| 2011 | $7,665 -0.4% | $47,300 |
| 2010 | $7,697 +4.4% | $47,300 |
| 2009 | $7,376 -7.9% | $47,300 -15.3% |
| 2008 | $8,011 +1% | $55,846 |
| 2007 | $7,931 -1.1% | $55,846 |
| 2006 | $8,017 +479.9% | $55,846 +52.9% |
| 2005 | $1,383 -4.8% | $36,523 |
| 2004 | $1,452 -6.4% | $36,523 |
| 2003 | $1,551 -11.6% | $36,523 +45.1% |
| 2002 | $1,755 -6.6% | $25,167 |
| 2001 | $1,878 -8.8% | $25,167 |
| 2000 | $2,059 -13.8% | $25,167 +59.4% |
| 1999 | $2,389 | $15,788 |
Find assessor info on the county website
Monthly payment
Est. payment
Payment breakdown
Explore the cost of this home by adjusting the details. Changes won't be saved.Climate risks
Neighborhood: Humboldt Park
Nearby schools


Similar homes
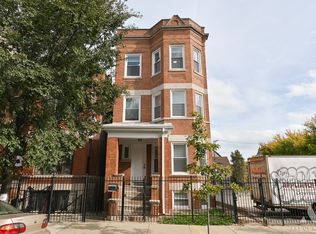
- $1,490,00010 bd4 ba-- sqft1505 N Rockwell St, Chicago, IL 60622New
 MLS ID #12801217, George Filippidis, Delta Realty, Corp.. MRED as distributed by MLS GRID
- $1,375,00011 bd4 ba-- sqft1429 N Fairfield Ave, Chicago, IL 60622Active
 MLS ID #12758542, Sara Abbasi, Equity Market Realty Inc.. MRED as distributed by MLS GRID
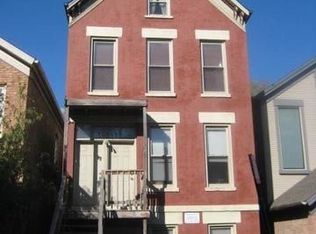
- $1,249,0007 bd5 ba-- sqft1736 W Beach Ave, Chicago, IL 60622New
 MLS ID #12801447, George Ayling, Select a Fee RE System. MRED as distributed by MLS GRID
- $950,00011 bd7 ba-- sqft3317 W Division St, Chicago, IL 60651New
 MLS ID #12802894, Jacek Predki, Avondale Realty LLC. MRED as distributed by MLS GRID
