First time on the market in about 80 years! Situated in the vibrant community of Elysian Valley, also known as "Frogtown." Adjacent to local parks, trendy cafes, the LA River bike path, and Dodger Stadium. This property is a perfect blend of urban living and outdoor lifestyle. Property will not qualify for financing, Cash Offers only! Great opportunity to re-invison this lot as many have done in the community. Don’t miss out on this prime Los Angeles property!
For sale
Listed by: Keller Williams Exclusive Properties • Heather Barkley Kilpatrick • Contact: 805-490-3280
Price cut: $84K (10/23)
$775,900
2724 Queen St, Los Angeles, CA 90039
2beds
720sqft
Single Family Residence
Built in 1923
5,447 Square Feet Lot
$-- Zestimate®
$1,078/sqft
$-- HOA
What's special
- 421 days
- 102
- 1
Zillow last checked:
Listing updated:
Listed by:
Heather Barkley Kilpatrick DRE #01213079 805-490-3280,
Keller Williams Exclusive Properties
Source: CRMLS,MLS#: SR26223976 Originating MLS: California Regional MLS
Facts & features
Interior
Bedrooms & bathrooms
- Bedrooms: 2
- Bathrooms: 1
- Full bathrooms: 1
- Main level bathrooms: 1
- Main level bedrooms: 2
Rooms
- Room types: Bedroom
Bedroom
- Features: All Bedrooms Down
Cooling
- None
Appliances
- Laundry: None
Features
- All Bedrooms Down
- Has fireplace: No
- Fireplace features: None
- Common walls with other units/homes: No Common Walls
Interior area
- Total interior livable area: 720 sqft
Property
Features
- Levels: One
- Stories: 1
- Entry location: 1
- Pool features: None
Lot
- Size: 5,447 Square Feet
- Features: Yard
Details
- Parcel number: 5442011030
- Special conditions: Trust
Construction
Type & style
- Home type: SingleFamily
- Property subtype: Single Family Residence
Condition
- New construction: No
- Year built: 1923
Utilities & green energy
- Sewer: Other
- Water: Other
Community & HOA
Community
- Features: Urban
Location
- Region: Los Angeles
Financial & listing details
- Price per square foot: $1,078/sqft
- Tax assessed value: $32,437
- Date on market: 10/16/2026
- Cumulative days on market: 421 days
- Listing terms: Cash,1031 Exchange
- Inclusions: None
- Exclusions: All tenants property
Estimated market value
Not available
Estimated sales range
Not available
$4,254/mo
Price history
| Date | Event | Price |
|---|---|---|
| 10/23/2026 | Price change | $775,900-9.8%$1,078/sqft |
Source:  CRMLS #SR26223976 Report a problem | ||
| 10/22/2026 | Price change | $859,900-13.9%$1,194/sqft |
Source: CRMLS #SR26223976 Report a problem | ||
| 10/16/2026 | Listed for sale | $999,000-4.9%$1,388/sqft |
Source: CRMLS #SR26223976 Report a problem | ||
| 11/1/2025 | Listing removed | $1,050,000$1,458/sqft |
Source:  SDMLS #SR24186275 Report a problem | ||
| 6/23/2025 | Contingent | $1,050,000$1,458/sqft |
Source: SDMLS #SR24186275 Report a problem | ||
Public tax history
| Year | Property taxes | Tax assessment |
|---|---|---|
| 2026 | -- | $32,437 +2% |
| 2025 | $641 -0.5% | $31,802 +2% |
| 2024 | $644 +1.7% | $31,180 +2% |
| 2023 | $633 +4.8% | $30,569 +2% |
| 2022 | $604 +2.1% | $29,971 +2% |
| 2021 | $592 +0% | $29,384 +1% |
| 2020 | $592 | $29,084 +2% |
| 2019 | $592 +10.9% | $28,515 +2% |
| 2018 | $533 | $27,956 +2% |
| 2017 | $533 +2.5% | $27,409 +2% |
| 2016 | $520 +3.8% | $26,873 +1.5% |
| 2015 | $501 -1% | $26,471 +2% |
| 2014 | $506 | $25,953 +2.5% |
| 2012 | -- | $25,331 +2% |
| 2011 | -- | $24,836 +0.7% |
| 2010 | -- | $24,652 -0.2% |
| 2009 | -- | $24,711 +2% |
| 2008 | -- | $24,227 +2% |
| 2007 | -- | $23,753 +2% |
| 2006 | -- | $23,288 |
| 2005 | -- | $23,288 +4% |
| 2004 | -- | $22,385 +1.9% |
| 2003 | -- | $21,975 +2% |
| 2002 | -- | $21,545 +4% |
| 2000 | -- | $20,710 |
Find assessor info on the county website
Monthly payment
Est. payment
Payment breakdown
Explore the cost of this home by adjusting the details. Changes won't be saved.Climate risks
Neighborhood: Elysian Valley


Similar homes
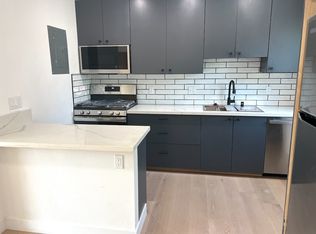
- $775,9002 bd2 ba920 sqft2728 Queen St, Los Angeles, CA 90039For Sale
 MLS ID #SR26223992, Heather Barkley Kilpatrick, Keller Williams Exclusive Properties. CRMLS
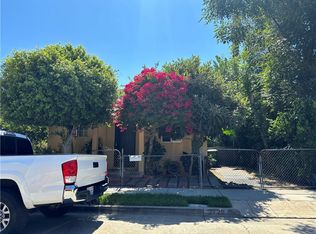
- $859,9002 bd1 ba560 sqft2723 Pirtle St, Los Angeles, CA 90039For Sale
 MLS ID #SR26224011, Heather Barkley Kilpatrick, Keller Williams Exclusive Properties. CRMLS
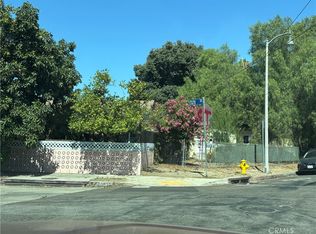
- $859,9002 bd1 ba932 sqft2746 Benedict St, Los Angeles, CA 90039For Sale
 MLS ID #SR26224035, Heather Barkley Kilpatrick, Keller Williams Exclusive Properties. CRMLS
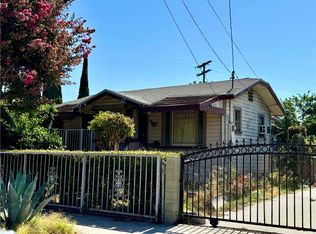
- $--1 bd1 ba616 sqft5622 Marmion Way, Los Angeles, CA 90042Auction
 Auction.com 2
