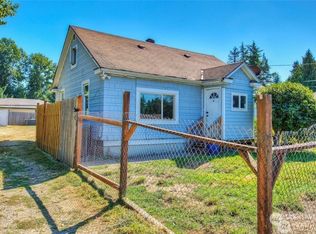
$550,000
3 bd2 ba1.2k sqft
13113 SE 277th Pl, Kent, WA 98030
Sold
$746,600
$694,000 - $806,000
$3,087/mo
$3,087/mo
Rent Zestimate®
Find your next renter with Zillow Rental Manager. Plus, with online applications, you can quickly screen prospective tenants – for free.
$3,087/mo
Rent Zestimate®
$4,796/mo
Est. payment
Refinancing to a lower rate could help reduce your monthly payments and save thousands over the life of the loan.
$4,796/mo
Est. payment
Work with a Zillow partner agent
Leverage their expertise and Zillow's premium Showcase listings to get your home seen by more buyers.
Get startedList with your own agent
Get your home in front of millions of buyers by listing it on Zillow.
Learn how to do itSell it yourself
Take full control of how buyers see your home on Zillow by listing For Sale by Owner (FSBO).
List your homeZillow last checked:
Listing updated:
Cindi Lynn Johnston 206-931-7524 cindi@ethosnwrealty.com,
Ethos Northwest Realty
Cindi Lynn Johnston, 21002369
Ethos Northwest Realty

| Date | Event | Price |
|---|---|---|
| 9/21/2026 | Sold | $750,000+20.6%$414/sqft |
Source:  NWMLS as distributed by MLS GRID #2586183 Report a problem | ||
| 10/22/2025 | Sold | $622,000-6.5%$344/sqft |
Source: NWMLS as distributed by MLS GRID #2448177 Report a problem | ||
| 12/6/2020 | Listing removed | $664,950$367/sqft |
Source: Keller Williams Realty PS #1646329 Report a problem | ||
| 10/30/2020 | Listed for sale | $664,950$367/sqft |
Source: Keller Williams Realty PS #1650704 Report a problem | ||
| 10/17/2020 | Pending sale | $664,950$367/sqft |
Source: Keller Williams Realty PS #1650704 Report a problem | ||
| 10/13/2020 | Price change | $664,950-2.2%$367/sqft |
Source: Keller Williams Realty PS #1650704 Report a problem | ||
| 9/22/2020 | Price change | $679,950-2.9%$376/sqft |
Source: Keller Williams Realty PS #1650704 Report a problem | ||
| 8/13/2020 | Listed for sale | $699,950-6.5%$387/sqft |
Source: Keller Williams Realty PS #1646329 Report a problem | ||
| 6/2/2020 | Listing removed | $749,000$414/sqft |
Source: W.E. Ruth Real Estate, Inc. #1534671 Report a problem | ||
| 5/13/2020 | Price change | $749,000-6.3%$414/sqft |
Source: W.E. Ruth Real Estate, Inc. #1561985 Report a problem | ||
| 5/6/2020 | Price change | $799,000+6.7%$441/sqft |
Source: W.E. Ruth Real Estate, Inc. #1561985 Report a problem | ||
| 3/8/2020 | Price change | $749,000-6.3%$414/sqft |
Source: W.E. Ruth Real Estate, Inc. #1561985 Report a problem | ||
| 2/21/2020 | Price change | $799,000+6.7%$441/sqft |
Source: W.E. Ruth Real Estate, Inc. #1561985 Report a problem | ||
| 2/14/2020 | Price change | $749,000-6.3%$414/sqft |
Source: W.E. Ruth Real Estate, Inc. #1561985 Report a problem | ||
| 10/24/2019 | Price change | $799,000+6.5%$441/sqft |
Source: W.E. Ruth Real Estate, Inc. #1561985 Report a problem | ||
| 6/1/2019 | Listed for sale | $749,900+83.3%$414/sqft |
Source: Tribeca NW Real Estate #1561985 Report a problem | ||
| 7/26/2016 | Sold | $409,000+203.2%$226/sqft |
Source: NWMLS as distributed by MLS GRID #894653 Report a problem | ||
| 4/14/2016 | Listing removed | $1,900+8.6%$1/sqft |
Source: Owner Report a problem | ||
| 7/2/2013 | Listing removed | $1,750$1/sqft |
Source: Owner Report a problem | ||
| 6/25/2013 | Listed for rent | $1,750$1/sqft |
Source: Owner Report a problem | ||
| 8/15/2012 | Sold | $134,900$75/sqft |
Source: NWMLS as distributed by MLS GRID #339335 Report a problem | ||
| 8/3/2012 | Listed for sale | $134,900$75/sqft |
Source: WASHINGTON REALTY GROUP Report a problem | ||
| 6/27/2012 | Listing removed | $134,900$75/sqft |
Source: Washington Realty Group #339335 Report a problem | ||
| 6/19/2012 | Price change | $134,900-24.6%$75/sqft |
Source: WASHINGTON REALTY GROUP Report a problem | ||
| 5/26/2012 | Price change | $179,000-16.1%$99/sqft |
Source: WASHINGTON REALTY GROUP Report a problem | ||
| 4/29/2012 | Price change | $213,400-3%$118/sqft |
Source: WASHINGTON REALTY GROUP Report a problem | ||
| 4/5/2012 | Listed for sale | $220,000-17%$122/sqft |
Source: Washington Realty Group #339335 Report a problem | ||
| 10/18/2011 | Sold | $265,000$146/sqft |
Source: Public Record Report a problem | ||
| Year | Property taxes | Tax assessment |
|---|---|---|
| 2025 | $7,202 +9.8% | $674,000 +4% |
| 2024 | $6,560 +8.5% | $648,000 +13.5% |
| 2023 | $6,049 -8.4% | $571,000 -9.7% |
| 2022 | $6,603 +9.8% | $632,000 +25.4% |
| 2021 | $6,016 +14.4% | $504,000 +20.6% |
| 2020 | $5,261 +2.3% | $418,000 +2.5% |
| 2019 | $5,141 +13.7% | $408,000 +8.8% |
| 2018 | $4,522 +4.5% | $375,000 +16.5% |
| 2017 | $4,329 +17.8% | $322,000 +6.3% |
| 2016 | $3,673 | $303,000 +14.3% |
| 2015 | $3,673 | $265,000 +2.3% |
| 2014 | $3,673 | $259,000 +25.1% |
| 2013 | $3,673 | $207,000 +5.6% |
| 2012 | -- | $196,000 -13.3% |
| 2011 | -- | $226,000 -23.4% |
| 2010 | -- | $295,000 |
| 2009 | -- | $295,000 -4.2% |
| 2007 | -- | $308,000 +6.6% |
| 2006 | -- | $289,000 +24% |
| 2005 | -- | $233,000 +20.1% |
| 2001 | $2,760 +1% | $194,000 +6% |
| 2000 | $2,732 | $183,000 |