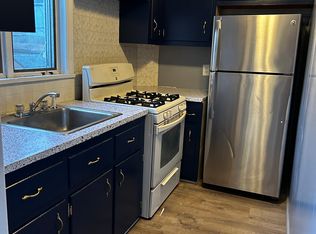
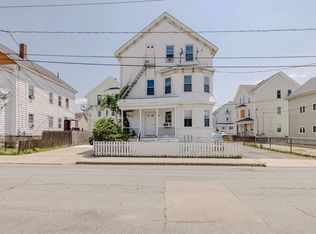
Don't miss this exceptional opportunity to acquire a spacious three-family property in a high-demand rental market. Located at 280 Ridge St, Fall River, this income-producing asset offers over 3,200 square feet of living space across three levels, featuring 8 bedrooms and 3 full bathrooms.What sets this property apart is its strong income stability. Current rents are at market value, providing investors with reliable cash flow from day one. With continued strong rental demand throughout Fall River, this property offers a solid and dependable investment opportunity.Built in 1900, the property offers the charm and character of a classic New England multi-family while delivering the functionality today's tenants seek. The generous unit layouts provide ample living space, making them highly attractive to both current and future occupants.Whether you're an experienced investor looking to expand your portfolio or an owner-occupant seeking rental income to offset your mortgage, this pro
For sale
Price cut: $10K (6/23)
$689,999
280 Ridge St, Fall River, MA 02721
9beds
3,234sqft
:
Get pre-qualified$4,468/mo
3 Family
Built in 1900
-- sqft lot
$684,300 Zestimate®
$213/sqft
$-- HOA
What's special
Generous unit layouts
- 71 days |
- 300 |
- 12 |
Zillow last checked:
Listing updated:
Listed by:
Nadege Cadet 857-261-4458,
Fast Plus Realty, Inc. 857-261-4458,
Jenny Vlada Jeune 774-517-9157
Source: MLS PIN,MLS#: 73520005
Facts & features
Interior
Bedrooms & bathrooms
- Bedrooms: 9
- Bathrooms: 3
- Full bathrooms: 3
Features
- Has basement: No
- Has fireplace: No
Interior area
- Total structure area: 3,234
- Total interior livable area: 3,234 sqft
- Finished area above ground: 3,234
Property
Lot
- Size: 2,753 Square Feet
- Features: Other
Details
- Parcel number: M:0G07 B:0000 L:0052,2826013
- Zoning: N/A
Construction
Type & style
- Home type: MultiFamily
- Property subtype: 3 Family
Materials
- Foundation: Stone
Condition
- Year built: 1900
Utilities & green energy
- Sewer: Public Sewer
- Water: Public
Community & HOA
Location
- Region: Fall River
Financial & listing details
- Price per square foot: $213/sqft
- Tax assessed value: $497,900
- Annual tax amount: $5,701
- Date on market: 5/20/2026
- Total actual rent: 4200
Estimated market value
$684,300
$650,000 - $719,000
$1,711/mo
Price history
| Date | Event | Price |
|---|---|---|
| 6/23/2026 | Price change | $689,999-1.4%$213/sqft |
Source: MLS PIN #73520005 Report a problem | ||
| 5/20/2026 | Listed for sale | $699,999+27.3%$216/sqft |
Source: MLS PIN #73520005 Report a problem | ||
| 12/22/2023 | Sold | $550,000-4.3%$170/sqft |
Source: MLS PIN #73154416 Report a problem | ||
| 9/1/2023 | Listed for sale | $574,999-1.7%$178/sqft |
Source: MLS PIN #73154416 Report a problem | ||
| 8/30/2023 | Listing removed | -- |
Source: | ||
| 8/14/2023 | Price change | $584,999-1.7%$181/sqft |
Source: MLS PIN #73111140 Report a problem | ||
| 7/9/2023 | Price change | $594,900-0.8%$184/sqft |
Source: MLS PIN #73111140 Report a problem | ||
| 6/27/2023 | Price change | $599,900-2.4%$185/sqft |
Source: MLS PIN #73111140 Report a problem | ||
| 6/15/2023 | Price change | $614,900-2.4%$190/sqft |
Source: MLS PIN #73111140 Report a problem | ||
| 6/3/2023 | Price change | $629,999-1.6%$195/sqft |
Source: MLS PIN #73111140 Report a problem | ||
| 5/22/2023 | Price change | $639,999-1.5%$198/sqft |
Source: MLS PIN #73111140 Report a problem | ||
| 5/14/2023 | Listed for sale | $649,999+11.1%$201/sqft |
Source: MLS PIN #73111140 Report a problem | ||
| 3/2/2023 | Sold | $585,000+0.9%$181/sqft |
Source: MLS PIN #73078400 Report a problem | ||
| 2/12/2023 | Listed for sale | $579,900+9.4%$179/sqft |
Source: MLS PIN #73078400 Report a problem | ||
| 1/2/2022 | Contingent | $529,900$164/sqft |
Source: MLS PIN #72929895 Report a problem | ||
| 12/29/2021 | Listed for sale | $529,900$164/sqft |
Source: MLS PIN #72929895 Report a problem | ||
Public tax history
| Year | Property taxes | Tax assessment |
|---|---|---|
| 2025 | $5,701 -23.8% | $497,900 -23.5% |
| 2024 | $7,480 +7.6% | $651,000 +14.9% |
| 2023 | $6,950 +31.1% | $566,400 +34.8% |
| 2022 | $5,302 +8.1% | $420,100 +18.5% |
| 2021 | $4,903 +7.8% | $354,500 +12.6% |
| 2020 | $4,550 +13.3% | $314,900 +14.3% |
| 2019 | $4,017 +6.9% | $275,500 +7.2% |
| 2018 | $3,759 +6.2% | $257,100 +1.7% |
| 2017 | $3,538 +3.4% | $252,700 +0.6% |
| 2016 | $3,422 +8.1% | $251,100 +3.8% |
| 2015 | $3,165 -1.3% | $242,000 -5.1% |
| 2014 | $3,208 +2.2% | $255,000 -3% |
| 2013 | $3,138 +3.3% | $263,000 -5% |
| 2012 | $3,039 +2.9% | $276,800 -15.3% |
| 2010 | $2,954 +1.8% | $326,800 -9.2% |
| 2009 | $2,902 -5% | $360,000 -9.7% |
| 2008 | $3,056 +7.9% | $398,500 +1.1% |
| 2007 | $2,831 +12.4% | $394,300 +6.9% |
| 2006 | $2,518 +7.7% | $368,700 +19.9% |
| 2005 | $2,339 +31.4% | $307,400 +41.8% |
| 2004 | $1,780 +6.3% | $216,800 +38.7% |
| 2003 | $1,674 +8.8% | $156,300 |
| 2002 | $1,538 -9.3% | $156,300 -3.6% |
| 2000 | $1,696 +17% | $162,100 +2.7% |
| 1995 | $1,449 | $157,800 |
Find assessor info on the county website
Monthly payment
Est. payment
Payment breakdown
Explore the cost of this home by adjusting the details. Changes won't be saved.Climate risks
Neighborhood: Corky Row
Nearby schools
GreatSchools rating
- 4/10Henry Lord Community SchoolGrades: K-8Distance: 1.5 mi
- 2/10B M C Durfee High SchoolGrades: 9-12Distance: 2.2 mi
- $--3 bd1 ba1k sqft280 Ridge St #2, Fall River, MA 02721Off Market
- $603,0009 bd3 ba2.9k sqft270 Ridge St, Fall River, MA 02721Off Market
- $362,6004 bd1 ba1k sqft282 Ridge St, Fall River, MA 02721Off Market
- $757,2009 bd3 ba5.6k sqft290 Ridge St, Fall River, MA 02721Off Market
- $715,1008 bd5 ba3.8k sqft258 Ridge St, Fall River, MA 02721Off Market
- $617,6009 bd3 ba3k sqft277 Ridge St, Fall River, MA 02721Off Market
- $633,9007 bd3 ba3.3k sqft289 Ridge St, Fall River, MA 02721Off Market
- $711,7008 bd3 ba4.1k sqft300 Ridge St, Fall River, MA 02721Off Market
A local agent can set up tours, give advice and negotiate with sellers.
Similar homes
- $769,0009 bd3 ba3.6k sqft554 3rd St, Fall River, MA 02721For Sale
 MLS ID #73554412, Marcus Duviella, Divine Real Estate, Inc.. MLS PIN
 - $724,9008 bd3 ba3.8k sqft154 Mott St, Fall River, MA 02721For Sale
 MLS ID #73545062, Cindy Ferry, Keller Williams South Watuppa. MLS PIN
 - $699,9006 bd3 ba3.6k sqft284 Broadway, Fall River, MA 02721For Sale
 MLS ID #73515702, Zachary Midwood, Divine Real Estate, Inc.. MLS PIN
 - $690,0006 bd5 ba3.8k sqft207 Rodman St, Fall River, MA 02721For Sale
 MLS ID #73403451, Fatima Pires, Keller Williams South Watuppa. MLS PIN
 - $679,0009 bd3 ba3.1k sqft23-27 Ash St, Fall River, MA 02724For SaleMLS ID #73542351, Donna Davids, Coldwell Banker Realty - Easton. MLS PIN
- $749,0009 bd3 ba2.8k sqft162 Rockland St, Fall River, MA 02724For SaleMLS ID #73534031, Daniel Quintal, Dan Quintal Real Estate. MLS PIN
- $699,9008 bd3 ba3k sqft58 Tuttle St, Fall River, MA 02724For SaleMLS ID #73545400, Team ROSO, RE/MAX Vantage. MLS PIN
- $689,9996 bd3 ba4.2k sqft248-250 Jefferson St, Fall River, MA 02721For SaleMLS ID #73476887, Jennifer Eaton, ALANTE Real Estate. MLS PIN
- $729,9006 bd3 ba3.6k sqft15 Oliver St, Fall River, MA 02724For SaleMLS ID #73511459, George Hampton, MIG. MLS PIN
- $634,9749 bd3 ba3.1k sqft199 Franklin St, Fall River, MA 02720For SaleMLS ID #73539673, Mission Impossible Team, United Brokers. MLS PIN
- $629,9008 bd3 ba2.4k sqft147 Jefferson St, Fall River, MA 02721For SaleMLS ID #73509689, Kenneth A Mongeon, KAM Realty. MLS PIN
- $680,0006 bd3 ba2.9k sqft37 Eaton St, Fall River, MA 02723For SaleMLS ID #73549897, Carlos Vaquerano, eXp Realty LLC - Corporate Office. MLS PIN
- $799,9006 bd5 ba3.1k sqft155 Rodman St, Fall River, MA 02721For SaleMLS ID #73500571, Gilded Girls Group, Beach Homes Realty, LLC. MLS PIN
- $618,0008 bd3 ba2.6k sqft953 Globe St, Fall River, MA 02724For SaleMLS ID #73537315, Laurem Payano, United Brokers. MLS PIN
- $749,9007 bd4 ba3k sqft72 Tower St, Fall River, MA 02724For SaleMLS ID #73551990, Brian Balestracci, Milestone Realty, Inc.. MLS PIN
- $729,0008 bd3 ba3.7k sqft118 Maple St, Fall River, MA 02720For SaleMLS ID #73480956, Jendel Oliveira, Lamacchia Realty, Inc.. MLS PIN
- $714,90010 bd3 ba4.4k sqft11 Choate St, Fall River, MA 02723For SaleMLS ID #73548539, Tania Mazzarella, Amaral & Associates RE. MLS PIN
- $715,0006 bd3 ba3.7k sqft149 Mason St, Fall River, MA 02723For SaleMLS ID #73529627, Kyle Emond, Lion Gate Real Estate, Inc.. MLS PIN
- $774,9009 bd3 ba2.7k sqft48 Tuttle St, Fall River, MA 02724For SaleMLS ID #73542106, Team ROSO, RE/MAX Vantage. MLS PIN
- $675,0006 bd3 ba3.1k sqft552 Alden St, Fall River, MA 02723For SaleMLS ID #73545183, Katie Elderkin, Keller Williams South Watuppa. MLS PIN
