Welcome home to 2813 63rd Street in Lubbock! This inviting home offers 3 bedrooms, 2 bathrooms, and two spacious living areas, providing plenty of room to relax, entertain, and enjoy everyday living. With a versatile layout and space for everyone, this home offers wonderful potential for comfortable living and making lasting memories. Don't miss the opportunity to make this home your own!
For sale
$160,000
2813 63rd St, Lubbock, TX 79413
3beds
1,411sqft
Single Family Residence, Residential
Built in 1956
6,969 Square Feet Lot
$156,800 Zestimate®
$113/sqft
$-- HOA
What's special
Versatile layout
- 41 days
- 242
- 42
Zillow last checked:
Listing updated:
Listed by:
Jessica Dykes TREC #0731233 806-789-8287,
Realty Refined
Source: LBMLS,MLS#: 202614001
Facts & features
Interior
Bedrooms & bathrooms
- Bedrooms: 3
- Bathrooms: 2
- Full bathrooms: 2
Heating
- Central
Cooling
- Central Air
Appliances
- Included: Dishwasher, Microwave, Oven
Features
- Ceiling Fan(s)
- Number of fireplaces: 1
- Fireplace features: Living Room
Interior area
- Total structure area: 1,411
- Total interior livable area: 1,411 sqft
- Finished area above ground: 1,411
Property
Parking
- Parking features: Garage
Features
- Exterior features: None
Lot
- Size: 6,969 Square Feet
Details
- Parcel number: R85178
Construction
Type & style
- Home type: SingleFamily
- Property subtype: Single Family Residence, Residential
Materials
- Brick
- Foundation: Slab
- Roof: Composition
Condition
- New construction: No
- Year built: 1956
Community & HOA
Community
- Security: None
Location
- Region: Lubbock
Financial & listing details
- Price per square foot: $113/sqft
- Tax assessed value: $155,895
- Annual tax amount: $2,871
- Date on market: 10/10/2026
- Listing terms: Cash,Conventional,FHA,VA Loan
- Road surface type: All Weather
Estimated market value
$156,800
$149,000 - $165,000
$1,438/mo
Price history
| Date | Event | Price |
|---|---|---|
| 10/10/2026 | Listed for sale | $160,000+26.5%$113/sqft |
Source:  LBMLS #202614001 Report a problem | ||
| 1/2/2021 | Listing removed | $126,500$90/sqft |
Source: HouseChaser #202009401 Report a problem | ||
| 12/16/2020 | Price change | $126,500-2.7%$90/sqft |
Source: HouseChaser #202009401 Report a problem | ||
| 9/25/2020 | Listed for sale | $130,000$92/sqft |
Source: HouseChaser #202009401 Report a problem | ||
| 8/15/2013 | Sold | -- |
Source: Agent Provided Report a problem | ||
| 12/7/2012 | Sold | -- |
Source: Public Record Report a problem | ||
Public tax history
| Year | Property taxes | Tax assessment |
|---|---|---|
| 2026 | -- | $155,895 -3.9% |
| 2025 | $2,871 -7.7% | $162,235 -5.3% |
| 2024 | $3,110 +0.8% | $171,251 +3.2% |
| 2023 | $3,084 +5.3% | $165,926 +14.7% |
| 2022 | $2,928 +24.1% | $144,628 +30.3% |
| 2021 | $2,360 +4.5% | $110,954 +5.2% |
| 2020 | $2,258 +0.5% | $105,423 +2% |
| 2019 | $2,247 +14.3% | $103,348 +3.5% |
| 2018 | $1,966 | $99,891 +14.2% |
| 2017 | $1,966 +16.2% | $87,444 |
| 2016 | $1,691 | $87,444 +9.5% |
| 2015 | $1,691 | $79,851 +5% |
| 2014 | $1,691 | $76,050 |
| 2013 | -- | $76,050 |
| 2012 | -- | $76,050 |
| 2011 | -- | $76,050 |
| 2010 | -- | $76,050 |
| 2009 | -- | $76,050 +2.9% |
| 2008 | -- | $73,879 -1.9% |
| 2007 | -- | $75,282 +7.8% |
| 2006 | -- | $69,857 +23.2% |
| 2005 | -- | $56,683 |
| 2004 | -- | $56,683 +3.5% |
| 2003 | -- | $54,746 +20.4% |
| 2002 | $1,127 +9.1% | $45,471 +9% |
| 2001 | $1,033 +0.7% | $41,735 |
| 2000 | $1,026 | $41,735 |
Find assessor info on the county website
Monthly payment
Est. payment
Payment breakdown
Explore the cost of this home by adjusting the details. Changes won't be saved.Climate risks
Neighborhood: Caprock


Similar homes
- $155,0004 bd2 ba1.6k sqft2723 66th St, Lubbock, TX 79413For Sale
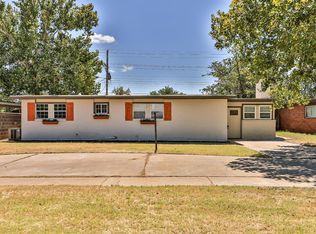 MLS ID #202615582, Amy Furst, Our Texas Real Estate Group. LBMLS
- $164,9003 bd2 ba1.6k sqft6611 Canton Ave, Lubbock, TX 79413For Sale
 MLS ID #202613491, Michael Norsworthy, eXp Realty LLC. LBMLS
- $--3 bd2 ba1.5k sqft2620 45th St, Lubbock, TX 79413Auction
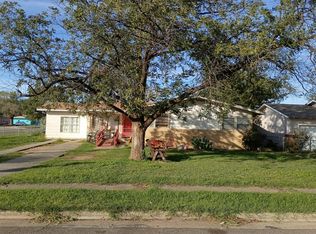 Auction.com 2
- $199,9993 bd3 ba1.7k sqft2829 66th St, Lubbock, TX 79413For Sale
 MLS ID #202615542, Michael Norsworthy, eXp Realty LLC. LBMLS
