Welcome All Investors. With a little TLC, this property would be a great rental with instant equity.
Pending
$68,000
290 Bracewell Dr APT B, Baton Rouge, LA 70815
2beds
1,248sqft
Townhouse
Built in 1990
435 Square Feet Lot
$-- Zestimate®
$54/sqft
$-- HOA
What's special
- 91 days
- 14
- 0
Zillow last checked:
Listing updated:
Listed by:
Irish Griffin-Potts,
Elite Realty & Investments Group LLC 225-938-1781
Source: ROAM MLS,MLS#: 2026014830
Facts & features
Interior
Bedrooms & bathrooms
- Bedrooms: 2
- Bathrooms: 3
- Full bathrooms: 2
- 1/2 bathrooms: 1
Bedroom
- Level: Second
- Area: 120 Square Feet
- Dimensions: 10 x 12
Bedroom
- Level: Second
- Area: 120 Square Feet
- Dimensions: 10 x 12
Bathroom
- Level: Second
- Area: 40 Square Feet
- Dimensions: 8 x 5
Bathroom
- Level: Second
- Area: 40 Square Feet
- Dimensions: 8 x 5
Bathroom
- Level: First
- Area: 25 Square Feet
- Dimensions: 5 x 5
Heating
- Central
Cooling
- Central Air
Interior area
- Total structure area: 1,248
- Total interior livable area: 1,248 sqft
Property
Parking
- Parking features: Assigned
Features
- Levels: Two
- Stories: 2
Lot
- Size: 435 Square Feet
- Dimensions: 25 x 25 x 25 x 25
Details
- Parcel number: 312096
Construction
Type & style
- Home type: Townhouse
- Architectural style: Acadian
- Property subtype: Townhouse
- Attached to another structure: Yes
Materials
- Wood Siding
- Foundation: Slab
Condition
- Year built: 1990
Utilities & green energy
- Sewer: Public Sewer
- Water: Public
Community & HOA
Community
- Subdivision: One Florida Place II
HOA
- Has HOA: Yes
Location
- Region: Baton Rouge
Financial & listing details
- Price per square foot: $54/sqft
- Tax assessed value: $87,500
- Annual tax amount: $288
- Date on market: 8/12/2026
- Listing terms: Cash,Conventional
Estimated market value
Not available
Estimated sales range
Not available
Not available
Price history
| Date | Event | Price |
|---|---|---|
| 8/15/2026 | Pending sale | $68,000$54/sqft |
Source:  ROAM MLS #2026014830 Report a problem | ||
| 8/12/2026 | Listed for sale | $68,000$54/sqft |
Source: ROAM MLS #2026014830 Report a problem | ||
| 3/31/2025 | Sold | -- |
Source: Public Record Report a problem | ||
Public tax history
| Year | Property taxes | Tax assessment |
|---|---|---|
| 2025 | $288 +22% | $8,750 |
| 2024 | $236 +149.4% | $8,750 +16.7% |
| 2023 | $95 +0% | $7,500 |
| 2022 | $95 | $7,500 |
| 2021 | $95 | $7,500 |
| 2020 | $95 -89.6% | $7,500 |
| 2019 | $908 +1.3% | $7,500 |
| 2018 | $897 +827.2% | $7,500 |
| 2017 | $97 | $7,500 |
| 2016 | $97 | $7,500 |
| 2015 | $97 -1.7% | $7,500 |
| 2014 | $98 | $7,500 |
| 2013 | $98 -88.7% | $7,500 |
| 2012 | $872 +11% | $7,500 +2% |
| 2011 | $786 +0% | $7,350 |
| 2010 | $786 +696.7% | $7,350 |
| 2009 | $99 | $7,350 |
| 2008 | $99 +27.3% | $7,350 +31.3% |
| 2007 | $78 0% | $5,600 |
| 2006 | $78 +0% | $5,600 |
| 2005 | $78 +2.6% | $5,600 |
| 2004 | $76 +134.1% | $5,600 +148.9% |
| 2003 | $32 | $2,250 |
| 2002 | $32 | $2,250 |
| 2001 | $32 +72% | $2,250 |
| 2000 | $19 | $2,250 |
Find assessor info on the county website
Monthly payment
Est. payment
Payment breakdown
Explore the cost of this home by adjusting the details. Changes won't be saved.Climate risks
Neighborhood: Broadmoor
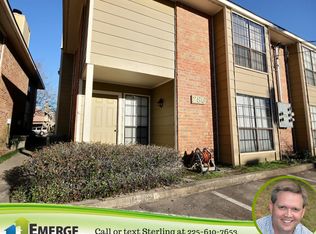
- $87,5002 bd3 ba1.2k sqft290 Bracewell Dr APT A, Baton Rouge, LA 70815Off Market

- $95,2002 bd3 ba1.2k sqft290 Bracewell Dr APT C, Baton Rouge, LA 70815Off Market

- $---- bd-- ba1.2k sqft290 Bracewell Dr APT D, Baton Rouge, LA 70815Sold
- $107,3002 bd3 ba1.2k sqft286 Bracewell Dr APT A, Baton Rouge, LA 70815Off Market
Similar homes
- $77,0002 bd3 ba1.1k sqft1739 Boulevard De Province #A, Baton Rouge, LA 70816For Sale

 MLS ID #200JMU, Brittany Collins, Alvin Washington Realty. ROAM MLS
- $85,0003 bd2 ba1.3k sqft10914 Red Oak Dr, Baton Rouge, LA 70815For Sale
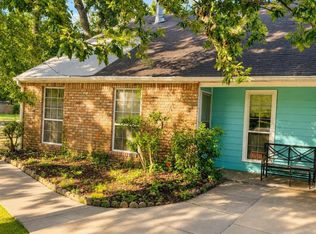 MLS ID #2026009206, Shemika Mayfield, Keller Williams Realty-First Choice. ROAM MLS
- $45,0003 bd2 ba1.3k sqft10665 Black Oak Dr, Baton Rouge, LA 70815Auction
 Xome
- $77,4002 bd3 ba1k sqft8091 Bayou Fountain Ave APT 601, Baton Rouge, LA 70820For Sale
 MLS ID #2026014782, Juli Jenkins, Keller Williams Realty-First Choice. ROAM MLS
- $85,0002 bd3 ba1.1k sqft1765 Boulevard De Province, Baton Rouge, LA 70816For SaleMLS ID #2025003942, Richard Spears, Prime Properties Realty Group, LLC. ROAM MLS
- $65,0002 bd1 ba1.1k sqft5156 Jackson Ave, Baton Rouge, LA 70806For SaleMLS ID #2026016270, Starr Daigre, Starr Real Estate. ROAM MLS
- $70,0003 bd2 ba1.1k sqft6327 Blueberry St, Baton Rouge, LA 70806For SaleMLS ID #2026014291, Sharon Aikens, Real Estate Marketplace. ROAM MLS
- $76,5003 bd2 ba1.2k sqft4518 Y A Tittle Ave APT 16, Baton Rouge, LA 70820For SaleMLS ID #2026014847, Irish Griffin-Potts, Elite Realty & Investments Group LLC. ROAM MLS
- $65,0002 bd1 ba1.3k sqft4239 Delaware St, Baton Rouge, LA 70805For SaleMLS ID #2026017245, LaRhonda Thomas, Keller Williams Realty-First Choice. ROAM MLS
- $55,9002 bd2 ba756 sqft1247 N 37th St, Baton Rouge, LA 70802For SaleMLS ID #2026015225, LaRhonda Thomas, Keller Williams Realty-First Choice. ROAM MLS
- $65,0003 bd1 ba1.1k sqft6232 Dawson Dr, Baton Rouge, LA 70805For SaleMLS ID #2026017993, Shannon LeBlanc, 1% Lists Acadiana. ROAM MLS
- $75,0002 bd2 ba1.4k sqft6155 N Foster Dr, Baton Rouge, LA 70805For SaleMLS ID #2026009270, Kevin Doiron, Geaux Home Real Estate. ROAM MLS
- $75,0003 bd1 ba1k sqft4242 Monroe Ave, Baton Rouge, LA 70802For SaleMLS ID #2026017614, LaRhonda Thomas, Keller Williams Realty-First Choice. ROAM MLS
- $70,0003 bd2 ba1.6k sqft5852 Saint Katherine Ave, Baton Rouge, LA 70805For SaleMLS ID #2026011976, Katina Moses, KC Homes Realty Group. ROAM MLS
- $80,0002 bd3 ba1.1k sqft10280 W Winston Ave APT 10, Baton Rouge, LA 70809For SaleMLS ID #2026000819, Maria Thorn, eXp Realty. ROAM MLS
- $80,0002 bd3 ba1.1k sqft10298 W Winston Ave APT 8, Baton Rouge, LA 70809For SaleMLS ID #2026000845, Maria Thorn, eXp Realty. ROAM MLS
- $73,0003 bd1 ba1k sqft5974 Byron St, Baton Rouge, LA 70805For SaleMLS ID #2026014013, Shannon LeBlanc, 1% Lists Acadiana. ROAM MLS
- $75,0001 bd1 ba689 sqft10288 W Winston Ave APT 2, Baton Rouge, LA 70809For SaleMLS ID #200HSE, Stuart Bailey, Gaspard & Co Real Estate LLC. ROAM MLS
