Spacious home in with 3 bedrooms and 2 1/2 baths. Some update in recent years including replacement windows and furnace. Enclosed porch, partially fenced yard and 1 car detached garage.
Active
$150,000
2920 Jefferson St, Muskegon Heights, MI 49444
3beds
1,670sqft
Single Family Residence
Built in 1935
6,098 Square Feet Lot
$-- Zestimate®
$90/sqft
$-- HOA
What's special
Partially fenced yardEnclosed porchReplacement windows
- 45 days
- 127
- 8
Zillow last checked:
Listing updated:
Listed by:
Cheryl Ann Palmer-Subka 231-578-0576,
Coldwell Banker Woodland Schmidt Grand Haven 616-844-9000
Source: MichRIC,MLS#: 26050904
Facts & features
Interior
Bedrooms & bathrooms
- Bedrooms: 3
- Bathrooms: 3
- Full bathrooms: 2
- 1/2 bathrooms: 1
- Main level bedrooms: 1
Heating
- Forced Air
Appliances
- Laundry: In Basement
Features
- Windows: Replacement
- Basement: Full
- Has fireplace: No
Interior area
- Total structure area: 1,670
- Total interior livable area: 1,670 sqft
- Finished area below ground: 0
Video & virtual tour
Property
Parking
- Total spaces: 1
- Parking features: Garage Faces Side, Detached
- Garage spaces: 1
Features
- Stories: 2
Lot
- Size: 6,098 Square Feet
- Dimensions: 50 x 125
- Features: Sidewalk
Details
- Parcel number: 26185226001500
Construction
Type & style
- Home type: SingleFamily
- Architectural style: Traditional
- Property subtype: Single Family Residence
Materials
- Vinyl Siding
- Roof: Shingle
Condition
- New construction: No
- Year built: 1935
Utilities & green energy
- Sewer: Public Sewer
- Water: Public
Community & HOA
Location
- Region: Muskegon Heights
Financial & listing details
- Price per square foot: $90/sqft
- Tax assessed value: $56,100
- Annual tax amount: $3,278
- Date on market: 9/24/2026
- Listing terms: Cash,Conventional
- Road surface type: Paved
Estimated market value
Not available
Estimated sales range
Not available
Not available
Price history
| Date | Event | Price |
|---|---|---|
| 9/24/2026 | Listed for sale | $150,000+9.5%$90/sqft |
Source:  MichRIC #26050904 Report a problem | ||
| 10/28/2024 | Sold | $137,000+9.7%$82/sqft |
Source: MichRIC #24034597 Report a problem | ||
| 9/13/2024 | Pending sale | $124,900$75/sqft |
Source: MichRIC #24034597 Report a problem | ||
| 8/21/2024 | Price change | $124,900-3.8%$75/sqft |
Source: MichRIC #24034597 Report a problem | ||
| 8/14/2024 | Pending sale | $129,900$78/sqft |
Source: MichRIC #24034597 Report a problem | ||
| 7/8/2024 | Listed for sale | $129,900+2606.3%$78/sqft |
Source: MichRIC #24034597 Report a problem | ||
| 12/26/2013 | Sold | $4,800-18.6%$3/sqft |
Source: Public Record Report a problem | ||
| 10/20/2013 | Price change | $5,900-14.5%$4/sqft |
Source: Greenridge Realty Inc. #13004104 Report a problem | ||
| 8/31/2013 | Price change | $6,900-12.7%$4/sqft |
Source: Greenridge Realty Inc. #13004104 Report a problem | ||
| 7/23/2013 | Price change | $7,900-7.1%$5/sqft |
Source: Greenridge Realty Inc. #13004104 Report a problem | ||
| 5/22/2013 | Price change | $8,500-14.1%$5/sqft |
Source: Greenridge Realty Inc. #13004104 Report a problem | ||
| 2/2/2013 | Price change | $9,900-16.8%$6/sqft |
Source: Greenridge Realty Inc. #13004104 Report a problem | ||
| 11/14/2012 | Price change | $11,900-20.1%$7/sqft |
Source: Greenridge Realty Inc. #12053878 Report a problem | ||
| 10/4/2012 | Listed for sale | $14,900-29%$9/sqft |
Source: Greenridge Realty Inc. #12053878 Report a problem | ||
| 12/12/2011 | Sold | $21,000-74.4%$13/sqft |
Source: Public Record Report a problem | ||
| 2/28/2006 | Sold | $82,000+232.2%$49/sqft |
Source: Public Record Report a problem | ||
| 2/7/2005 | Sold | $24,683-1.3%$15/sqft |
Source: Public Record Report a problem | ||
| 12/11/2003 | Sold | $25,000$15/sqft |
Source: Public Record Report a problem | ||
Public tax history
| Year | Property taxes | Tax assessment |
|---|---|---|
| 2026 | $2,467 +42.8% | $70,000 +24.8% |
| 2025 | $1,727 -1.4% | $56,100 +72.1% |
| 2024 | $1,751 +2.5% | $32,600 +39.9% |
| 2023 | $1,707 | $23,300 +2.6% |
| 2022 | -- | $22,700 +38.4% |
| 2021 | $1,133 | $16,400 +10.1% |
| 2020 | $1,133 +53.9% | $14,900 +893.3% |
| 2018 | $736 | $1,500 -91.9% |
| 2017 | -- | $18,500 +37% |
| 2016 | -- | $13,500 -9.4% |
| 2015 | -- | $14,900 -21.2% |
| 2014 | -- | $18,900 -16% |
| 2013 | -- | $22,500 -11.1% |
| 2012 | -- | $25,300 -20.2% |
| 2011 | -- | $31,700 |
| 2010 | -- | $31,700 -17.2% |
| 2009 | -- | $38,300 -13.9% |
| 2008 | -- | $44,500 +17.1% |
| 2007 | -- | $38,000 |
| 2006 | -- | $38,000 +95.9% |
| 2005 | -- | $19,400 +11.5% |
| 2004 | -- | $17,400 +1.2% |
| 2003 | -- | $17,200 -1.1% |
| 2002 | -- | $17,400 +5.5% |
| 2001 | -- | $16,500 +3.8% |
| 2000 | -- | $15,900 |
Find assessor info on the county website
Monthly payment
Est. payment
Payment breakdown
Explore the cost of this home by adjusting the details. Changes won't be saved.Climate risks
Neighborhood: 49444
- $98,400-- bd1 ba1.1k sqft2924 Jefferson St, Muskegon Heights, MI 49444Off Market
- $4,200-- bd1 ba2.6k sqft2916 Jefferson St, Muskegon Heights, MI 49444Off Market
- $97,400-- bd1 ba876 sqft2928 Jefferson St, Muskegon Heights, MI 49444Off Market
- $152,4003 bd2 ba1.5k sqft2912 Jefferson St, Muskegon Heights, MI 49444Off Market
Similar homes
- $145,0005 bd2 ba1.8k sqft2313 Riordan St, Muskegon Heights, MI 49444For Sale
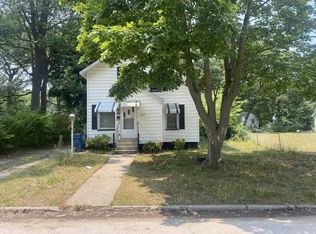
 MLS ID #26053178, Christal Booker, TLK Real Estate Inc.. MichRIC
- $155,0003 bd1 ba1.3k sqft3132 5th St, Muskegon Heights, MI 49444For Sale
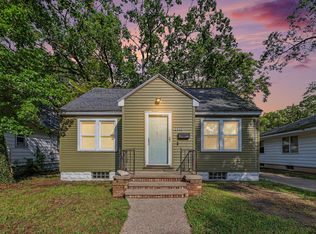 MLS ID #26047386, Drake Johnson, Legacy Real Estate Partners. MichRIC
- $139,9002 bd1 ba896 sqft519 E Norton Ave, Muskegon, MI 49444For Sale
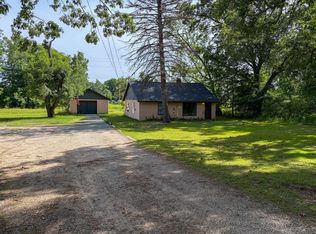 MLS ID #26058546, Alexys Apol, Greenridge - Nexes. MichRIC
- $159,9002 bd1 ba971 sqft2829 9th St, Muskegon Heights, MI 49444For Sale
 MLS ID #26057875, Jane M McGregor, Five Star Real Estate. MichRIC
- $159,9002 bd2 ba1k sqft2928 Lemuel St, Muskegon Heights, MI 49444For SaleMLS ID #26046320, Anthony Lambers, HomeRealty, LLC. MichRIC
- $155,0003 bd2 ba1.4k sqft1632 5th St, Muskegon, MI 49441For SaleMLS ID #26055186, Caleb Henderson, Century 21 Affiliated (GR). MichRIC
- $109,9003 bd1 ba1.2k sqft2905 7th St, Muskegon Heights, MI 49444For SaleMLS ID #26053193, Anthony Nanna, Greenridge - Nexes. MichRIC
- $179,0003 bd3 ba1.6k sqft2716 7th St, Muskegon Heights, MI 49444For SaleMLS ID #26010820, Diana Carol Cain, RE/MAX West. MichRIC
- $134,9004 bd1 ba1k sqft71 Crescent Ave, Muskegon Heights, MI 49444For SaleMLS ID #26013430, Diana Carol Cain, RE/MAX West. MichRIC
- $174,9003 bd1 ba900 sqft2853 Valley St, Muskegon, MI 49444For SaleMLS ID #26055917, Angela Ferrier, Homeflex Realty, Inc. MichRIC
- $129,9003 bd1 ba925 sqft2304 Dyson St, Muskegon Heights, MI 49444For SaleMLS ID #26042073, Jason Ball, Century 21 Affiliated GR. MichRIC
- $114,9003 bd2 ba1k sqft2611 Wood St, Muskegon Heights, MI 49444For SaleMLS ID #26045742, Linda Sakocius, Epique Realty. MichRIC
- $140,0003 bd1 ba972 sqft1505 7th St, Muskegon, MI 49441For SaleMLS ID #26050860, Eddie Alexander, Five Star Real Estate - N Musk. MichRIC
- $134,9003 bd2 ba1.7k sqft1298 Spring St, Muskegon, MI 49442For SaleMLS ID #26039164, Veronika Anderson, RE/MAX West. MichRIC
- $179,9003 bd1 ba1.3k sqft1059 Ada Ave, Muskegon, MI 49442For SaleMLS ID #26058592, Mary Koehler, Target Realty Group LLC. MichRIC
- $169,9003 bd2 ba1.2k sqft1918 Franklin St, Muskegon, MI 49441For SaleMLS ID #26047334, Joseph A Ferrier, Port City Real Estate Inc. MichRIC
- $125,5002 bd1 ba936 sqft2525 Reynolds St, Muskegon Heights, MI 49444For SaleMLS ID #26042547, Jason Gracik, Landmark Real Estate Group. MichRIC
- $169,0005 bd2 ba2.4k sqft401 Monroe Ave, Muskegon, MI 49441For SaleMLS ID #26057421, Terry Adams, A.L.C. Realty. MichRIC
