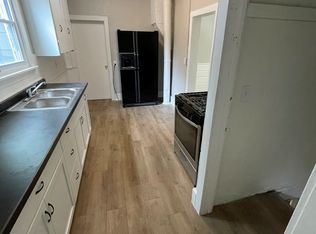
INVESTOR OPPORTUNITY! Fully occupied triplex offering immediate rental income with all three units currently leased and generating $3,000 per month. Each unit has been freshly refreshed, providing clean, comfortable living spaces for tenants. The exterior has also received fresh paint, giving the property a clean, well-maintained appearance. All units have current Certificates of Occupancy, providing added peace of mind for the next owner. Whether you're expanding your rental portfolio or looking for an income-producing property with tenants already in place, this triplex offers a great opportunity to step into an established rental investment with income from day one. Buyer and buyer's agent to verify all information.
Active
$179,000
2716 7th St, Muskegon Heights, MI 49444
3beds
3baths
1,652sqft
2 to 4 Units
Built in 1915
-- sqft lot
$176,200 Zestimate®
$108/sqft
$-- HOA
What's special
Clean well-maintained appearanceClean comfortable living spaces
- 214 days
- 102
- 8
Zillow last checked:
Listing updated:
Listed by:
Diana Carol Cain 231-733-1236,
RE/MAX West 231-733-1236
Source: MichRIC,MLS#: 26010820
Facts & features
Interior
Bedrooms & bathrooms
- Bedrooms: 3
- Bathrooms: 3
Heating
- Forced Air, Wall Furnace
Features
- Basement: Partial
Interior area
- Total interior livable area: 1,652 sqft
Video & virtual tour
Property
Parking
- Total spaces: 4
Lot
- Size: 9,583 Square Feet
- Dimensions: 75 x 125
Details
- Parcel number: 26185191002000
Construction
Type & style
- Home type: MultiFamily
- Property subtype: 2 to 4 Units
Materials
- Wood Siding
- Roof: Composition
Condition
- New construction: No
- Year built: 1915
Utilities & green energy
- Sewer: Public Sewer
- Utilities for property: Natural Gas Available, Electricity Available, Cable Available, Natural Gas Connected, Electricity Connected, Cable Connected
Community & HOA
Location
- Region: Muskegon Heights
Financial & listing details
- Price per square foot: $108/sqft
- Tax assessed value: $24,682
- Annual tax amount: $1,129
- Date on market: 3/20/2026
- Listing terms: Cash,Conventional
- Tenant pays: Electricity, Gas
- Electric utility on property: Yes
Estimated market value
$176,200
$167,000 - $185,000
$1,215/mo
Price history
| Date | Event | Price |
|---|---|---|
| 9/29/2026 | Listed for sale | $179,000-0.5%$108/sqft |
Source:  MichRIC #26010820 Report a problem | ||
| 3/20/2026 | Listed for sale | $179,900+124.9%$109/sqft |
Source: MichRIC #26010820 Report a problem | ||
| 6/8/2022 | Sold | $80,000$48/sqft |
Source: Public Record Report a problem | ||
Public tax history
| Year | Property taxes | Tax assessment |
|---|---|---|
| 2025 | $1,479 -13.7% | $40,400 +45.8% |
| 2024 | $1,713 +51% | $27,700 +21.5% |
| 2023 | $1,135 | $22,800 +5.1% |
| 2022 | -- | $21,700 +7.4% |
| 2021 | $1,095 | $20,200 +12.2% |
| 2020 | $1,095 +49.8% | $18,000 +500% |
| 2018 | $731 | $3,000 -80.1% |
| 2017 | -- | $15,100 +12.7% |
| 2016 | -- | $13,400 -17.3% |
| 2015 | -- | $16,200 -3% |
| 2014 | -- | $16,700 +1.8% |
| 2013 | -- | $16,400 -8.4% |
| 2012 | -- | $17,900 -6.8% |
| 2011 | -- | $19,200 |
| 2010 | -- | $19,200 -10.7% |
| 2009 | -- | $21,500 -0.5% |
| 2008 | -- | $21,600 +1.9% |
| 2007 | -- | $21,200 |
| 2006 | -- | $21,200 +26.9% |
| 2005 | -- | $16,700 +1.8% |
| 2004 | -- | $16,400 +0.6% |
| 2003 | -- | $16,300 -1.2% |
| 2002 | -- | $16,500 +61.8% |
| 2001 | -- | $10,200 |
| 2000 | -- | $10,200 |
Find assessor info on the county website
Monthly payment
Est. payment
Payment breakdown
Explore the cost of this home by adjusting the details. Changes won't be saved.Climate risks
Neighborhood: 49444
Similar homes
- $150,0003 bd3 ba1.6k sqft2920 Jefferson St, Muskegon Heights, MI 49444For Sale
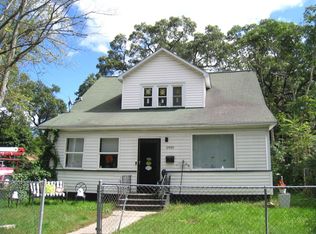
 MLS ID #26050904, Cheryl Ann Palmer-Subka, Coldwell Banker Woodland Schmidt Grand Haven. MichRIC
- $155,0003 bd2 ba1.4k sqft1632 5th St, Muskegon, MI 49441For Sale
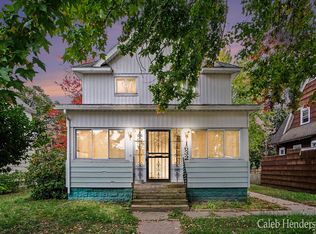 MLS ID #26055186, Caleb Henderson, Century 21 Affiliated (GR). MichRIC
- $175,0004 bd2 ba1.5k sqft855 Turner Ave, Muskegon, MI 49442For Sale
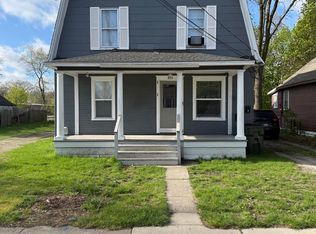 MLS ID #26018994, Shelby T Steenstra, Key Realty. MichRIC
- $164,9002 bd2 ba1k sqft2928 Lemuel St, Muskegon Heights, MI 49444For Sale
 MLS ID #26046320, Anthony Lambers, HomeRealty, LLC. MichRIC
- $119,9003 bd2 ba1.2k sqft2128 Hoyt St, Muskegon Heights, MI 49444For SaleMLS ID #26054813, Daphne Meneses, Legacy Real Estate Partners. MichRIC
- $164,9004 bd3 ba2.4k sqft190 W Dale Ave, Muskegon, MI 49441For SaleMLS ID #26051670, Gabriel E Clark, Bellabay Realty LLC. MichRIC
- $145,0005 bd2 ba1.8k sqft2313 Riordan St, Muskegon Heights, MI 49444For SaleMLS ID #26053178, Christal Booker, TLK Real Estate Inc.. MichRIC
- $155,0003 bd1 ba1.3k sqft3132 5th St, Muskegon Heights, MI 49444For SaleMLS ID #26047386, Drake Johnson, Legacy Real Estate Partners. MichRIC
- $199,9003 bd1 ba1.1k sqft569 Porter Rd, Norton Shores, MI 49441For SaleMLS ID #26053356, Janell M Takens, Keller Williams GR North. MichRIC
- $199,9004 bd2 ba1.8k sqft1465 Barclay St, Muskegon, MI 49441For SaleMLS ID #26043534, Emmett C TerBeek, Five Star Real Estate (Courtland). MichRIC
- $169,9003 bd2 ba1.2k sqft1918 Franklin St, Muskegon, MI 49441For SaleMLS ID #26047334, Joseph A Ferrier, Port City Real Estate Inc. MichRIC
- $179,9003 bd1 ba1.5k sqft1953 Jiroch St, Muskegon, MI 49442For SaleMLS ID #26039050, Veronika Anderson, RE/MAX West. MichRIC
- $190,0004 bd2 ba1.7k sqft510 Ada Ave, Muskegon, MI 49442For SaleMLS ID #26042212, Matthew Johnson, Greenridge - Nexes. MichRIC
- $199,9003 bd1 ba1.2k sqft1473 Division St, Muskegon, MI 49441For Sale
 MLS ID #50221685, Scott Fader, Joseph Walter Realty LLC. MiRealSource
- $149,9003 bd2 ba1.8k sqft1306 Terrace St, Muskegon, MI 49442For SaleMLS ID #26050836, Joseph Clement, Legacy Real Estate Partners. MichRIC
- $229,9003 bd1 ba1.8k sqft4356 Armstrong Rd, Norton Shores, MI 49441For SaleMLS ID #26055472, Sue Brink Smith, TrenSyd Realty LLC. MichRIC
- $149,9994 bd1 ba930 sqft3008 6th St, Muskegon, MI 49444For SaleMLS ID #26038496, Joanna Lasser, Five Star Real Estate - N Musk. MichRIC
- $109,9003 bd1 ba1.2k sqft2905 7th St, Muskegon Heights, MI 49444For SaleMLS ID #26053193, Anthony Nanna, Greenridge - Nexes. MichRIC
- $229,9005 bd3 ba1.8k sqft111 E Grand Ave, Muskegon, MI 49442For SaleMLS ID #26046086, Thomas A Serio, Real Estate West. MichRIC
