This 1426 square foot single family home has 3 bedrooms and 2.0 bathrooms. This home is located at 2925 Sage Ct, Fairfield, CA 94533.
Pre-foreclosure
Street View
Est. $535,100
2925 Sage Ct, Fairfield, CA 94533
3beds
1,426sqft
SingleFamily
Built in 1973
5,662 Square Feet Lot
$535,100 Zestimate®
$375/sqft
$138/mo HOA
Overview
- 43 days
- 6
- 0
Facts & features
Interior
Bedrooms & bathrooms
- Bedrooms: 3
- Bathrooms: 2
- Full bathrooms: 2
Heating
- Other
Cooling
- Central
Features
- Has fireplace: Yes
Interior area
- Total interior livable area: 1,426 sqft
Property
Parking
- Parking features: Garage - Attached
Features
- Exterior features: Other
Lot
- Size: 5,662 Square Feet
Details
- Parcel number: 0162022250
Construction
Type & style
- Home type: SingleFamily
Materials
- Roof: Composition
Condition
- Year built: 1973
Community & HOA
HOA
- Has HOA: Yes
- HOA fee: $138 monthly
Location
- Region: Fairfield
Financial & listing details
- Price per square foot: $375/sqft
- Tax assessed value: $496,986
Foreclosure details
Estimated market value
$535,100
$508,000 - $562,000
$2,550/mo
Price history
| Date | Event | Price |
|---|---|---|
| 10/24/2019 | Sold | $430,000+2.4%$302/sqft |
Source:  BAREIS #21924747 Report a problem | ||
| 9/20/2019 | Listed for sale | $419,900+10.5%$294/sqft |
Source: Coldwell Banker Kappel Gateway #21924747 Report a problem | ||
| 2/23/2005 | Sold | $380,000+43.4%$266/sqft |
Source: Public Record Report a problem | ||
| 10/4/2002 | Sold | $265,000+93.4%$186/sqft |
Source: Public Record Report a problem | ||
| 5/19/1995 | Sold | $137,000-8.7%$96/sqft |
Source: Public Record Report a problem | ||
| 6/6/1994 | Sold | $150,000$105/sqft |
Source: Public Record Report a problem | ||
Public tax history
| Year | Property taxes | Tax assessment |
|---|---|---|
| 2026 | -- | $496,986 +5.7% |
| 2025 | $5,252 0% | $470,262 +2% |
| 2024 | $5,254 +3.2% | $461,043 +2% |
| 2023 | $5,092 +1.2% | $452,004 +2% |
| 2022 | $5,030 +1% | $443,142 +2% |
| 2021 | $4,981 +2.4% | $434,454 +1% |
| 2020 | $4,864 +14.6% | $430,000 +12% |
| 2019 | $4,246 +1.4% | $384,000 +6.7% |
| 2018 | $4,187 +10.6% | $360,000 +7.5% |
| 2017 | $3,787 +10.9% | $335,000 +12% |
| 2016 | $3,415 +23.6% | $299,000 +16.8% |
| 2015 | $2,762 +15% | $256,000 +15.8% |
| 2014 | $2,402 | $221,000 +14.5% |
| 2013 | -- | $193,000 +15.6% |
| 2012 | -- | $167,000 -5.6% |
| 2011 | -- | $177,000 +4.1% |
| 2010 | -- | $170,000 -3.4% |
| 2009 | -- | $176,000 -38.5% |
| 2008 | -- | $286,000 -27.7% |
| 2007 | -- | $395,352 +2% |
| 2006 | -- | $387,600 +40.8% |
| 2005 | -- | $275,347 +2% |
| 2004 | -- | $269,948 +1.9% |
| 2003 | -- | $265,000 +70.1% |
| 2002 | -- | $155,762 +2% |
| 2001 | -- | $152,708 +2% |
| 2000 | $1,493 | $149,714 |
Find assessor info on the county website
Monthly payment
Climate risks
Neighborhood: 94533
Similar homes
- $460,0003 bd2 ba1.4k sqft2988 Orchid Street, Fairfield, CA 94533For Sale
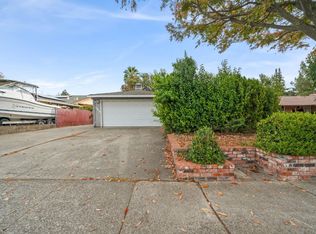 MLS ID #326091746, Alexander M Petty, eXp Realty of California, Inc. BAREIS
- $515,0003 bd2 ba1.3k sqft2964 Orchid Street, Fairfield, CA 94533For Sale
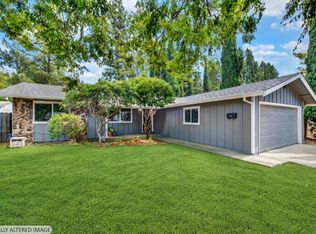 MLS ID #326082108, Jessie Kelly, Coldwell Banker Kappel Gateway. BAREIS
- $--3 bd2 ba1.1k sqft1412 Kent Way, Fairfield, CA 94533Auction
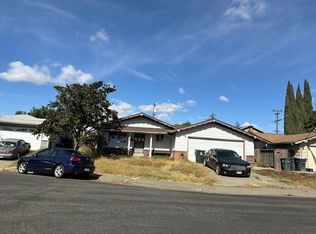 Auction.com 2
- $575,0003 bd2 ba1.7k sqft721 Shamrock Court, Fairfield, CA 94533For Sale
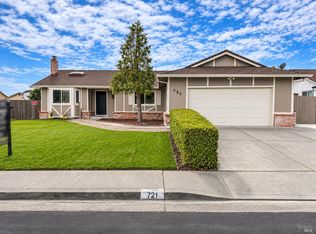 MLS ID #326090272, Alyssa M Anderson, 1st Realty & Investment. BAREIS
