You don't want to miss out on this investment opportunity! All four units are already leased until January 2023 and each consist of 2 bedrooms and 1 bathroom. 3 separate electrical and water meters. This quad currently brings in $2650 per month and tenants are responsible for their own utilities. There is room for rent increase in the future. Roof was replaced in 2018.
Pending
$320,000
2943 THOMAS Street, Jacksonville, FL 32254
8beds
2,448sqft
Quadruplex
Built in 1949
-- sqft lot
$252,900 Zestimate®
$131/sqft
$-- HOA
What's special
- 1724 days
- 5
- 0
Zillow last checked:
Listing updated:
Listed by:
DEVON WATKINS,
MOMENTUM REALTY 904-903-1558
Source: realMLS,MLS#: 1151605
Facts & features
Interior
Bedrooms & bathrooms
- Bedrooms: 8
- Bathrooms: 4
- Full bathrooms: 4
Heating
- Central
Cooling
- Central Air
Interior area
- Total interior livable area: 2,448 sqft
Property
Parking
- Parking features: Other
Features
- Stories: 2
- Pool features: None
Details
- Parcel number: 0565880000
Construction
Type & style
- Home type: MultiFamily
- Property subtype: Quadruplex
Condition
- Year built: 1949
Community & HOA
Community
- Subdivision: Fehrenbachs
Location
- Region: Jacksonville
Financial & listing details
- Price per square foot: $131/sqft
- Tax assessed value: $191,200
- Annual tax amount: $4,806
- Date on market: 2/17/2022
- Road surface type: Asphalt
Estimated market value
$252,900
$220,000 - $286,000
$1,171/mo
Price history
| Date | Event | Price |
|---|---|---|
| 3/2/2022 | Pending sale | $320,000$131/sqft |
Source:  realMLS #1151605 Report a problem | ||
| 2/17/2022 | Listed for sale | $320,000$131/sqft |
Source: realMLS #1151605 Report a problem | ||
| 2/15/2022 | Pending sale | $320,000$131/sqft |
Source: realMLS #1151605 Report a problem | ||
| 2/4/2022 | Contingent | $320,000$131/sqft |
Source: realMLS #1151605 Report a problem | ||
| 1/31/2022 | Listed for sale | $320,000+44.1%$131/sqft |
Source: realMLS #1151605 Report a problem | ||
| 5/28/2021 | Sold | $222,000+48%$91/sqft |
Source: realMLS #1092572 Report a problem | ||
| 6/14/2019 | Sold | $150,000-5.7%$61/sqft |
Source: realMLS #996331 Report a problem | ||
| 6/2/2019 | Pending sale | $159,000$65/sqft |
Source: LOVE REALTY, INC #996331 Report a problem | ||
| 5/21/2019 | Listed for sale | $159,000+1078.5%$65/sqft |
Source: LOVE REALTY, INC #996331 Report a problem | ||
| 10/25/2018 | Listing removed | $550 |
Source: Match Made Realty Report a problem | ||
| 7/25/2018 | Price change | $550-8.3% |
Source: Match Made Realty Report a problem | ||
| 7/6/2018 | Price change | $600+20% |
Source: Match Made Realty Report a problem | ||
| 4/23/2018 | Listed for rent | $500 |
Source: Zillow Rental Manager Report a problem | ||
| 7/1/2014 | Sold | $13,492-79.2%$6/sqft |
Source: Public Record Report a problem | ||
| 1/13/2005 | Sold | $65,000+66.7%$27/sqft |
Source: Public Record Report a problem | ||
| 11/18/2004 | Sold | $39,000$16/sqft |
Source: Public Record Report a problem | ||
Public tax history
| Year | Property taxes | Tax assessment |
|---|---|---|
| 2025 | $4,806 +20.1% | $191,200 +4.3% |
| 2024 | $4,001 +1% | $183,386 |
| 2023 | $3,960 +15.1% | -- |
| 2022 | $3,441 +26% | $159,483 +39.2% |
| 2021 | $2,730 +1.8% | $114,591 +3.1% |
| 2020 | $2,681 +22.8% | $111,112 +56% |
| 2019 | $2,184 +113.4% | $71,245 +544.1% |
| 2018 | $1,023 | $11,062 +10% |
| 2017 | $1,023 +12.7% | $10,057 +7.8% |
| 2016 | $908 +1.1% | $9,328 +5% |
| 2015 | $898 +0.6% | $8,884 -71.6% |
| 2014 | $893 | $31,268 +5.2% |
| 2013 | -- | $29,726 -8.6% |
| 2012 | -- | $32,518 -8.9% |
| 2011 | -- | $35,681 -30.7% |
| 2010 | -- | $51,463 -5% |
| 2009 | -- | $54,147 -32.3% |
| 2006 | -- | $80,010 +3.6% |
| 2005 | $1,434 | $77,200 +202.6% |
| 2004 | -- | $25,511 +5.5% |
| 2003 | $469 | $24,185 +3.9% |
| 2002 | -- | $23,283 +1.8% |
| 2001 | -- | $22,882 +3.3% |
| 2000 | -- | $22,160 +2.3% |
| 1999 | -- | $21,660 |
Find assessor info on the county website
Monthly payment
Est. payment
Payment breakdown
Explore the cost of this home by adjusting the details. Changes won't be saved.Climate risks
Neighborhood: Lackawanna

Similar homes
- $299,9006 bd4 ba3k sqft1548 W 6TH Street, Jacksonville, FL 32209For Sale
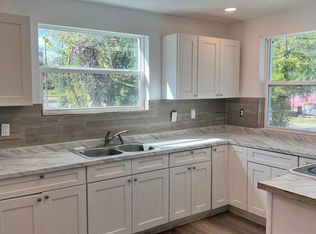 MLS ID #2167376, MORRIS VAHNISH. realMLS
- $325,0008 bd-- ba2.7k sqft1352 W 30TH Street, Jacksonville, FL 32209For Sale
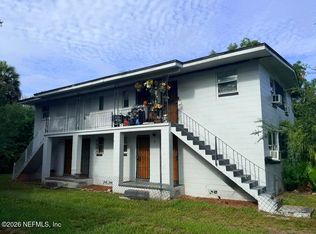 MLS ID #2158929, JAYNA SILVERMAN. realMLS
- $300,0008 bd3 ba2.7k sqft1567 6TH Street, Jacksonville, FL 32209For Sale
 MLS ID #2110060, BENJAMIN SCHWAB. realMLS
- $325,0008 bd-- ba2.8k sqft1024 W 29TH Street, Jacksonville, FL 32209For Sale
 MLS ID #2158918, JAYNA SILVERMAN. realMLS
