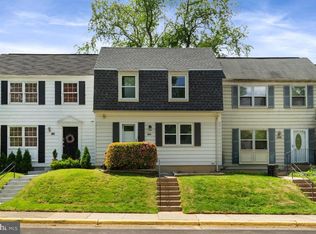
$640,000
3 bd3 ba1.4k sqft
2959 Tipperary Pass, Vienna, VA 22181
Sold

Likely to sell faster than
Zillow last checked:
Listing updated:
Doug Richards 703-609-2188,
TTR Sotheby's International Realty 7037149030,
Co-Listing Agent: Mona Banes 703-909-5620,
TTR Sotheby's International Realty

Not available
Estimated sales range
Not available
Not available
| Date | Event | Price |
|---|---|---|
| 9/10/2026 | Listed for sale | $599,000-4.9%$468/sqft |
Source:  Bright MLS #VAFX2339288 Report a problem Bright MLS #VAFX2339288 Report a problem | ||
| 7/22/2024 | Sold | $630,000-1.6%$492/sqft |
Source: Bright MLS #VAFX2186326 Report a problem | ||
| 7/16/2024 | Pending sale | $640,000$500/sqft |
Source: Bright MLS #VAFX2186326 Report a problem | ||
| 6/26/2024 | Contingent | $640,000$500/sqft |
Source: Bright MLS #VAFX2186326 Report a problem | ||
| 6/14/2024 | Listed for sale | $640,000+48%$500/sqft |
Source: Bright MLS #VAFX2186326 Report a problem | ||
| 12/1/2017 | Sold | $432,500-0.6%$338/sqft |
Source: Public Record Report a problem | ||
| 11/21/2017 | Pending sale | $435,000$340/sqft |
Source: Falls Church #1000157441 Report a problem | ||
| 10/26/2017 | Listed for sale | $435,000$340/sqft |
Source: Keller Williams Realty Falls Church #FX10016770 Report a problem | ||
| 10/26/2017 | Pending sale | $435,000$340/sqft |
Source: Keller Williams Realty Falls Church #FX10016770 Report a problem | ||
| 9/10/2017 | Pending sale | $435,000$340/sqft |
Source: Falls Church #FX10016770 Report a problem | ||
| 9/1/2017 | Price change | $435,000-2.2%$340/sqft |
Source: Falls Church #FX10016770 Report a problem | ||
| 7/30/2017 | Listed for sale | $445,000+27.1%$348/sqft |
Source: Keller Williams Realty Falls Church #FX10016770 Report a problem | ||
| 1/17/2006 | Sold | $350,000$273/sqft |
Source: Public Record Report a problem | ||
| Year | Property taxes | Tax assessment |
|---|---|---|
| 2025 | $6,861 +17.1% | $593,490 +17.4% |
| 2024 | $5,857 -2.3% | $505,560 -4.8% |
| 2023 | $5,995 +2.3% | $531,250 +3.7% |
| 2022 | $5,858 | $512,300 +11.8% |
| 2021 | -- | $458,300 +4.7% |
| 2020 | $5,181 +1.2% | $437,780 +1.2% |
| 2019 | $5,122 +2.5% | $432,780 +2.5% |
| 2018 | $4,996 +1.9% | $422,100 |
| 2017 | $4,901 +2.1% | $422,100 +1.9% |
| 2016 | $4,799 +3.8% | $414,250 |
| 2015 | $4,623 +4.8% | $414,250 +4.6% |
| 2014 | $4,412 | $396,190 +7.4% |
| 2013 | -- | $368,790 +7.3% |
| 2012 | -- | $343,730 +5.4% |
| 2011 | -- | $326,170 +2.6% |
| 2010 | -- | $317,860 -7.6% |
| 2009 | -- | $344,180 -10.1% |
| 2008 | -- | $382,790 -3.9% |
| 2007 | -- | $398,530 +95.8% |
| 2003 | -- | $203,585 +20% |
| 2002 | -- | $169,655 +26.5% |
| 2001 | -- | $134,115 |
Source: Bright MLS. This data may not be complete. We recommend contacting the local school district to confirm school assignments for this home.
A local agent can set up tours, give advice and negotiate with sellers.