GREAT INVESTMENT OPPORTUNITY IN MIAMI! This income-producing property features a duplex with two additional efficiency units, offering four rental income streams. All four units are currently rented, generating a combined monthly rental income of $7,800. The duplex consists of two main units renting for $2,500 per month each, while the two efficiencies rent for $1,400 per month each. Each unit has a one-month security deposit, and tenants pay their own electricity and Wi-Fi. Situated on a 7,471-square-foot lot, this property presents an attractive opportunity for investors seeking rental income. Conveniently located near major roadways, shopping, dining, and local amenities.
For sale
$1,000,000
3001 NW 21st Ct, Miami, FL 33142
6beds
4baths
2,094sqft
Duplex
Built in 1952
-- sqft lot
$-- Zestimate®
$478/sqft
$-- HOA
What's special
- 22 days
- 126
- 13
Likely to sell faster than
Zillow last checked:
Listing updated:
Listed by:
Fabrizio Quintana 786-602-0011,
London Foster Realty
Source: MIAMI,MLS#: A12112536 Originating MLS: A-Miami Association of REALTORS
Facts & features
Interior
Bedrooms & bathrooms
- Bedrooms: 6
- Bathrooms: 4
Heating
- Central
Cooling
- Central Air
Features
- Flooring: Tile
Interior area
- Total structure area: 2,416
- Total interior livable area: 2,094 sqft
Video & virtual tour
Property
Parking
- Total spaces: 5
Features
- Stories: 1
Lot
- Features: Less Than 1/4 Acre Lot
Details
- Parcel number: 0131270190060
- Zoning: 3900
Construction
Type & style
- Home type: MultiFamily
- Property subtype: Duplex
Materials
- CBS Construction
- Roof: Other
Condition
- Year built: 1952
Utilities & green energy
- Sewer: Public Sewer
Green energy
- Energy efficient items: HVAC
Community & HOA
Community
- Subdivision: Eby Park
HOA
- Has HOA: No
Location
- Region: Miami
Financial & listing details
- Price per square foot: $478/sqft
- Tax assessed value: $496,367
- Annual tax amount: $9,730
- Date on market: 10/25/2026
- Listing terms: All Cash,Assumable,Conventional
Estimated market value
Not available
Estimated sales range
Not available
Not available
Price history
| Date | Event | Price |
|---|---|---|
| 10/25/2026 | Listed for sale | $1,000,000+53.8%$478/sqft |
Source:  MIAMI #A12112536 Report a problem | ||
| 3/27/2023 | Sold | $650,000$310/sqft |
Source: MIAMI #A11342152 Report a problem | ||
| 2/13/2023 | Listed for sale | $650,000$310/sqft |
Source: MIAMI #A11342152 Report a problem | ||
| 2/2/2023 | Listing removed | -- |
Source: MIAMI #A11267157 Report a problem | ||
| 10/15/2022 | Price change | $650,000-10.3%$310/sqft |
Source: MIAMI #A11267157 Report a problem | ||
| 9/2/2022 | Listed for sale | $725,000+345.1%$346/sqft |
Source: MIAMI #A11267157 Report a problem | ||
| 2/1/2014 | Listing removed | $162,900$78/sqft |
Source: Miami New Realty #A1811264 Report a problem | ||
| 7/10/2013 | Listed for sale | $162,900-1.9%$78/sqft |
Source: Miami New Realty #A1811264 Report a problem | ||
| 7/2/2003 | Sold | $166,000+27.7%$79/sqft |
Source: Public Record Report a problem | ||
| 2/17/2000 | Sold | $130,000$62/sqft |
Source: Public Record Report a problem | ||
Public tax history
| Year | Property taxes | Tax assessment |
|---|---|---|
| 2025 | $9,730 +3.8% | $490,973 +4% |
| 2024 | $9,377 +53.5% | $471,895 +143.4% |
| 2023 | $6,108 +14% | $193,909 +10% |
| 2022 | $5,358 +5.2% | $176,281 +14.7% |
| 2021 | $5,093 +16.1% | $153,750 +10% |
| 2020 | $4,389 +6.8% | $139,773 +10% |
| 2019 | $4,110 +6.5% | $127,067 +10% |
| 2018 | $3,858 | $115,516 +10% |
| 2017 | $3,858 +13.6% | $105,015 +10% |
| 2016 | $3,397 +13.5% | $95,469 +10% |
| 2015 | $2,993 -1.2% | $86,790 +10% |
| 2014 | $3,030 -5% | $78,900 +10% |
| 2013 | $3,191 | $71,728 -33.3% |
| 2012 | $3,191 -14.6% | $107,589 +0.9% |
| 2011 | $3,737 -28.1% | $106,621 -41.8% |
| 2010 | $5,199 -20.3% | $183,352 -27.3% |
| 2009 | $6,525 -9.8% | $252,039 -15.2% |
| 2007 | $7,233 +39.8% | $297,152 |
| 2006 | $5,174 | -- |
| 2005 | $5,174 -4.2% | -- |
| 2004 | $5,400 +69.3% | -- |
| 2003 | $3,189 -8.3% | -- |
| 2002 | $3,478 | -- |
| 2001 | $3,478 | -- |
Find assessor info on the county website
Monthly payment
Est. payment
Payment breakdown
Explore the cost of this home by adjusting the details. Changes won't be saved.Climate risks
Neighborhood: Allapattah
Similar homes
- $799,9995 bd3 ba2.4k sqftWesthaven, Miami, FL 33142For Sale

 MLS ID #A12113066, Justin Kirkwood, Luxe Properties. MIAMI
- $875,7004 bd4 ba2.3k sqftCaples Amd Pl, Miami, FL 33142For Sale
 MLS ID #A11389399, Roberto Claro, Pinnacle Realty of Florida Corp. MIAMI
- $875,7004 bd4 ba2.5k sqftCaples Amd Pl, Miami, FL 33142For Sale
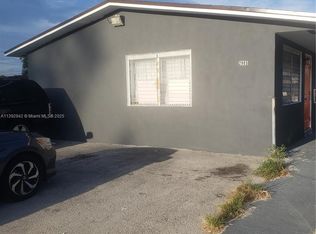 MLS ID #A11392942, Roberto Claro, Pinnacle Realty of Florida Corp. MIAMI
- $698,0006 bd3 ba2.5k sqftMelrose Heights, Miami, FL 33142For Sale
 MLS ID #A12115768, Justine Jimenez Garcia, Countywide Properties ERA Powe. MIAMI
- $810,0004 bd4 ba2.1k sqftCravatts Allapattah Homes, Miami, FL 33142For SaleMLS ID #A12001094, Enolismel Padilla, LP Realty Group. MIAMI
- $769,0005 bd6 ba2.5k sqftEast Haven, Miami, FL 33142For SaleMLS ID #A12091273, Maria Auxiliadora Ruiz Marrero, Keller Williams Realty International Lifestyles. MIAMI
- $610,0005 bd3 ba1.9k sqftMelrose Heights 4th Sec, Miami, FL 33142For SaleMLS ID #A12123744, Edna Cabrera, Legacy Realty Partners, LLC.. MIAMI
- $585,0003 bd3 ba1.9k sqftMelrose Heights, Miami, FL 33142For SaleMLS ID #A12121499, Oscar Arellano Jr., Coldwell Banker Realty. MIAMI
- $1,074,0004 bd4 ba3k sqftHolleman Manor Addn, Miami, FL 33142For SaleMLS ID #A11944416, Lourdes Muro, All Hud Realty and Management,. MIAMI
- $995,0006 bd4 ba2.5k sqftRidgeview Sub, Miami, FL 33125For SaleMLS ID #A12053485, Julio Hernandez, Select International Realty, LLC.. MIAMI
- $725,0003 bd2 ba3k sqftPalm Park Amd, Miami, FL 33142For SaleMLS ID #A12117795, Sofia Rovirosa, The Corcoran Group. MIAMI
- $595,9006 bd3 ba1.7k sqft17th Ave Manor 2nd Addn, Miami, FL 33142For SaleMLS ID #A12119971, Idalia Nunez, London Foster Realty. MIAMI
- $950,0006 bd4 ba2.8k sqft2805 NW 11th Street, Miami, FL 33125For Sale
 MLS ID #B26087580, Rodrigue Lissade, Roger Lissade Realty. BeachesMLS
- $999,0005 bd4 ba2.3k sqftKenwood 1st Addn, Miami, FL 33125For SaleMLS ID #A11976995, Orlando Leon, The Keyes Company. MIAMI
- $895,0008 bd4 ba2.2k sqftNo Miami Est Sec 3, Miami, FL 33142For SaleMLS ID #A12021879, Ezequiel Baredes, BM2 Realty. MIAMI
- $645,0004 bd2 ba1.1k sqft17th Ave Manor 2nd Addn, Miami, FL 33142For SaleMLS ID #A12123150, Alexander Calzadilla, Nexus International Realty. MIAMI
- $995,0006 bd3 ba1.8k sqftBlvd Park, Miami, FL 33127For SaleMLS ID #A11979891, Moises Btesh, Related General Realty, LLC.. MIAMI
- $1,150,0008 bd3 ba1.9k sqft3025 NW 8TH Avenue, Miami, FL 33127For SaleMLS ID #B26099977, Bruna Kunhasky, Sealine Realty Inc. BeachesMLS
- $995,0008 bd6 ba2.6k sqftWest End Park Amd Pl, Miami, FL 33142New ConstructionMLS ID #A12055496, Miguel Marino, Cespedes Realty LLC. MIAMI
- $610,0007 bd4 ba2.7k sqftHolleman Manor, Miami, FL 33142For SaleMLS ID #A12075194, Miguel Fuentes, Fausto Commercial Realty Consultants Inc. MIAMI
