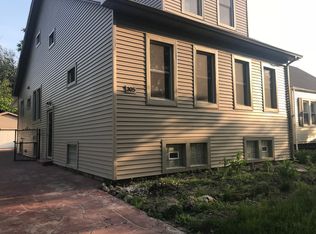
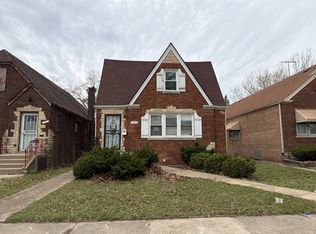
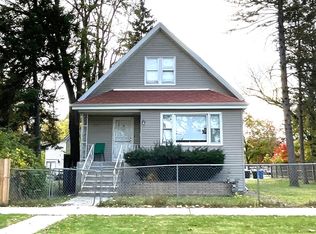
This 672 square foot single family home has 4 bedrooms and 1.0 bathrooms. This home is located at 309 W 124th St, Chicago, IL 60628.
Foreclosed
Est. $179,000
309 W 124th St, Chicago, IL 60628
4beds
1baths
672sqft
SingleFamily
Built in 1950
4,791 Square Feet Lot
$179,000 Zestimate®
$266/sqft
$-- HOA
Overview
- 379 days |
- 17 |
- 0 |
Facts & features
Interior
Bedrooms & bathrooms
- Bedrooms: 4
- Bathrooms: 1
Heating
- Other, Gas
Cooling
- Central
Appliances
- Included: Range / Oven, Refrigerator
Features
- Flooring: Tile, Carpet, Hardwood
Interior area
- Total interior livable area: 672 sqft
Property
Parking
- Total spaces: 3
- Parking features: Garage - Attached
Features
- Exterior features: Other
Lot
- Size: 4,791 Square Feet
Details
- Parcel number: 2528407005
Construction
Type & style
- Home type: SingleFamily
Materials
- Frame
- Roof: Other
Condition
- Year built: 1950
Community & HOA
Location
- Region: Chicago
Financial & listing details
- Price per square foot: $266/sqft
- Tax assessed value: $100,000
Visit our professional directory to find a foreclosure specialist in your area that can help with your home search.
Find a foreclosure agentForeclosure details
Estimated market value
$179,000
$161,000 - $197,000
$2,118/mo
Price history
| Date | Event | Price |
|---|---|---|
| 3/17/2016 | Sold | $107,500$160/sqft |
Source: | ||
| 2/9/2016 | Pending sale | $107,500$160/sqft |
Source: Fuqua Real Estate Services LLC #09118003 Report a problem | ||
| 1/26/2016 | Price change | $107,500-1.4%$160/sqft |
Source: Fuqua Real Estate Services LLC #09118003 Report a problem | ||
| 1/17/2016 | Listed for sale | $109,000+5.3%$162/sqft |
Source: Fuqua Real Estate Services LLC #09118003 Report a problem | ||
| 12/1/2015 | Listing removed | $103,500$154/sqft |
Source: Fuqua Real Estate Services LLC #09002300 Report a problem | ||
| 11/14/2015 | Price change | $103,500-0.2%$154/sqft |
Source: Fuqua Real Estate Services LLC #09002300 Report a problem | ||
| 11/5/2015 | Price change | $103,750-0.1%$154/sqft |
Source: Fuqua Real Estate Services LLC #09002300 Report a problem | ||
| 10/9/2015 | Price change | $103,900-1%$155/sqft |
Source: Fuqua Real Estate Services LLC #09002300 Report a problem | ||
| 9/26/2015 | Price change | $104,900-1.5%$156/sqft |
Source: Fuqua Real Estate Services LLC #09002300 Report a problem | ||
| 9/11/2015 | Price change | $106,500-1.3%$158/sqft |
Source: Fuqua Real Estate Services LLC #09002300 Report a problem | ||
| 8/25/2015 | Price change | $107,900-1.8%$161/sqft |
Source: Fuqua Real Estate Services LLC #09002300 Report a problem | ||
| 8/6/2015 | Listed for sale | $109,900-0.1%$164/sqft |
Source: Fuqua Real Estate Services LLC #09002300 Report a problem | ||
| 2/10/2015 | Listing removed | $109,990$164/sqft |
Source: Betts Realty Group, P.C. #08748717 Report a problem | ||
| 1/14/2015 | Listed for sale | $109,990-4.4%$164/sqft |
Source: Betts Realty Group, P.C. #08748717 Report a problem | ||
| 2/3/2004 | Sold | $115,000+283.3%$171/sqft |
Source: Public Record Report a problem | ||
| 2/25/2002 | Sold | $30,000$45/sqft |
Source: Public Record Report a problem | ||
Public tax history
| Year | Property taxes | Tax assessment |
|---|---|---|
| 2024 | -- | $10,000 +25% |
| 2023 | $1,692 +2.5% | $8,000 |
| 2022 | $1,650 +2.3% | $8,000 |
| 2021 | $1,613 -4.8% | $8,000 +5.4% |
| 2020 | $1,695 +0.9% | $7,589 -9% |
| 2019 | $1,680 +1.7% | $8,340 |
| 2018 | $1,652 -5.8% | $8,340 +2.6% |
| 2017 | $1,754 +7.5% | $8,130 |
| 2016 | $1,632 +9.3% | $8,130 |
| 2015 | $1,493 -2.1% | $8,130 -0.9% |
| 2014 | $1,526 +2% | $8,203 |
| 2013 | $1,495 +1.4% | $8,203 |
| 2012 | $1,475 -14.7% | $8,203 -23% |
| 2011 | $1,729 -0.4% | $10,648 |
| 2010 | $1,736 +4.4% | $10,648 |
| 2009 | $1,664 -7.4% | $10,648 -14.8% |
| 2008 | $1,797 +1.1% | $12,504 |
| 2007 | $1,778 -1.1% | $12,504 |
| 2006 | $1,797 +24.8% | $12,504 +42.1% |
| 2005 | $1,440 +1% | $8,801 |
| 2004 | $1,426 +2.2% | $8,801 |
| 2003 | $1,395 +16.8% | $8,801 +32.5% |
| 2002 | $1,195 +3.7% | $6,640 |
| 2001 | $1,152 +12% | $6,640 |
| 2000 | $1,029 -0.7% | $6,640 +24.2% |
| 1999 | $1,036 | $5,347 |
Find assessor info on the county website
Monthly payment
Estimated monthly payment$1,822
All calculations are estimates and provided by Zillow, Inc. for informational purposes only. Actual amounts may vary.
HOA fees may include property taxes on listings classified as Co-Ops. Contact the listing agent and/or owner for fee details.
Mortgage interest rates are dependent on a number of factors, including credit score, down payment, and repayment length. Interest rate data provided by Zillow Group Marketplace, Inc. as of 1/1/1970 from various mortgage lenders with which we have lead or other similar arrangements; the Estimated Payment is an average of those rates.
See how much you could borrow to make a competitive offer.
Climate risks
Neighborhood: West Pullman
Nearby schools
GreatSchools rating
- 4/10Metcalfe Elementary Community AcademyGrades: PK-8Distance: 0.2 mi
- NAFenger Academy High SchoolGrades: 9-12Distance: 1.5 mi

- Illinois
- Cook County
- Chicago
- 60628
- West Pullman
- 309 W 124th St
Nearby cities
Nearby neighborhoods
Nearby zip codes
Other Chicago Topics
