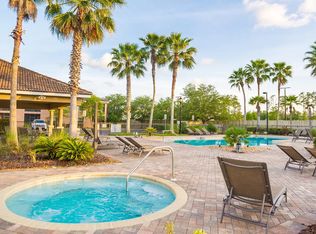
Updated 2 bedroom, 2 bathroom condo located in the Palencia community of St. Augustine. The unit features an updated kitchen and bathrooms, a new washer and dryer, and additional updates throughout. Community amenities include an adults-only pool, lap pool, fitness center, pickleball courts, tennis center, and walking and biking paths. Located in a quiet, well-maintained community with convenient access to Historic Downtown St. Augustine, area beaches, restaurants, shopping, and other local destinations. The condo combines updated interior features with access to Palencia's community amenities and a convenient St. Augustine location.
For sale
$215,000
310 Via Castilla St #202, Saint Augustine, FL 32095
2beds
1,278sqft
Condominium
Built in 2005
-- sqft lot
$-- Zestimate®
$168/sqft
$439/mo HOA
What's special
Tennis centerAdults-only poolNew washer and dryerFitness centerPickleball courtsWalking and biking pathsUpdated kitchen
- 58 days
- 811
- 23
Zillow last checked:
Listing updated:
Listed by:
Steven Koleno 804-656-5007,
Beycome Brokerage Realty
Source: St Augustine St Johns County BOR,MLS#: 264281
Facts & features
Interior
Bedrooms & bathrooms
- Bedrooms: 2
- Bathrooms: 2
- Full bathrooms: 2
Primary bedroom
- Level: First
- Area: 192
- Dimensions: 16 x 12
Features
- Flooring: Tile, Vinyl
Interior area
- Total structure area: 1,278
- Total interior livable area: 1,278 sqft
Property
Features
- Levels: Split
- Stories: 1
- Entry location: 2nd Story
- Patio & porch: Screened Porch
Details
- Parcel number: 0724211322
- Zoning: PUD
Construction
Type & style
- Home type: Condo
- Property subtype: Condominium
Materials
- Roof: Tile
Condition
- New construction: No
- Year built: 2005
Community & HOA
Community
- Subdivision: El Jardin
HOA
- Has HOA: Yes
- HOA fee: $1,318 quarterly
Location
- Region: Saint Augustine
Financial & listing details
- Price per square foot: $168/sqft
- Tax assessed value: $195,000
- Annual tax amount: $5,636
- Price range: $215K - $215K
- Date on market: 9/25/2026
Estimated market value
Not available
Estimated sales range
Not available
Not available
Price history
| Date | Event | Price |
|---|---|---|
| 9/25/2026 | Listed for sale | $215,000-1.6%$168/sqft |
Source:  St Augustine St Johns County BOR #264281 Report a problem | ||
| 9/25/2025 | Listing removed | $1,700$1/sqft |
Source: realMLS #2104912 Report a problem | ||
| 8/21/2025 | Listed for rent | $1,700$1/sqft |
Source: realMLS #2104912 Report a problem | ||
| 8/11/2025 | Listing removed | $218,500$171/sqft |
Source:  realMLS #2082729 Report a problem | ||
| 7/11/2025 | Price change | $218,500-2.4%$171/sqft |
Source: realMLS #2082729 Report a problem | ||
| 6/27/2025 | Price change | $223,900-0.4%$175/sqft |
Source: realMLS #2082729 Report a problem | ||
| 6/21/2025 | Price change | $224,900-2.2%$176/sqft |
Source: realMLS #2082729 Report a problem | ||
| 5/5/2025 | Price change | $229,900-5%$180/sqft |
Source: realMLS #2082729 Report a problem | ||
| 4/19/2025 | Listed for sale | $241,900-4.8%$189/sqft |
Source: realMLS #2082729 Report a problem | ||
| 8/21/2023 | Sold | $254,000-2.3%$199/sqft |
Source: realMLS #1233642 Report a problem | ||
| 7/28/2023 | Pending sale | $260,000$203/sqft |
Source: St Augustine St Johns County BOR #232985 Report a problem | ||
| 6/16/2023 | Listed for sale | $260,000$203/sqft |
Source: St Augustine St Johns County BOR #232985 Report a problem | ||
| 6/12/2023 | Pending sale | $260,000$203/sqft |
Source: St Augustine St Johns County BOR #232985 Report a problem | ||
| 5/30/2023 | Listed for sale | $260,000+6.1%$203/sqft |
Source: St Augustine St Johns County BOR #232985 Report a problem | ||
| 4/10/2023 | Sold | $245,000-2%$192/sqft |
Source: realMLS #1204951 Report a problem | ||
| 3/30/2023 | Pending sale | $250,000$196/sqft |
Source: realMLS #1204951 Report a problem | ||
| 3/24/2023 | Contingent | $250,000$196/sqft |
Source: St Augustine St Johns County BOR #229001 Report a problem | ||
| 2/25/2023 | Price change | $250,000-0.4%$196/sqft |
Source: realMLS #1204951 Report a problem | ||
| 2/22/2023 | Price change | $251,000-0.4%$196/sqft |
Source: St Augustine St Johns County BOR #229001 Report a problem | ||
| 2/4/2023 | Price change | $252,000-0.8%$197/sqft |
Source: realMLS #1204951 Report a problem | ||
| 1/26/2023 | Price change | $254,000-1.2%$199/sqft |
Source: St Augustine St Johns County BOR #229001 Report a problem | ||
| 1/18/2023 | Price change | $256,994-0.8%$201/sqft |
Source: St Augustine St Johns County BOR #229001 Report a problem | ||
| 12/17/2022 | Listed for sale | $259,000+78.6%$203/sqft |
Source: St Augustine St Johns County BOR #229001 Report a problem | ||
| 8/13/2019 | Sold | $145,000-3.3%$113/sqft |
Source: Public Record Report a problem | ||
| 7/6/2019 | Pending sale | $150,000$117/sqft |
Source: BEACH REALTY TEAM LLC #995312 Report a problem | ||
| 5/15/2019 | Price change | $150,000-3.2%$117/sqft |
Source: BEACH REALTY TEAM LLC #995312 Report a problem | ||
| 5/9/2019 | Listed for sale | $155,000-8.2%$121/sqft |
Source: Owner Report a problem | ||
| 9/2/2005 | Sold | $168,800$132/sqft |
Source: Public Record Report a problem | ||
Public tax history
| Year | Property taxes | Tax assessment |
|---|---|---|
| 2025 | $5,637 +2.6% | $195,000 -4.9% |
| 2024 | $5,492 +43.2% | $205,000 +62.2% |
| 2023 | $3,836 +0.9% | $126,401 +3% |
| 2022 | $3,802 -0.4% | $122,719 +3% |
| 2021 | $3,817 +0.2% | $119,145 +1.4% |
| 2020 | $3,810 -5.4% | $117,500 +3.1% |
| 2019 | $4,029 | $114,000 +10.7% |
| 2018 | $4,029 +11.7% | $103,000 +24.8% |
| 2017 | $3,607 | $82,500 +26.9% |
| 2016 | $3,607 +6.4% | $65,000 +8.5% |
| 2015 | $3,392 +6% | $59,895 +10% |
| 2014 | $3,200 | $54,450 +21% |
| 2013 | -- | $45,000 |
| 2012 | -- | $45,000 |
| 2011 | -- | $45,000 -10% |
| 2010 | -- | $50,000 -37.5% |
| 2009 | -- | $80,000 -34.7% |
| 2008 | -- | $122,500 -15.5% |
| 2007 | -- | $145,000 |
| 2006 | -- | $145,000 |
Find assessor info on the county website
Monthly payment
Est. payment
Payment breakdown
Explore the cost of this home by adjusting the details. Changes won't be saved.Climate risks
Neighborhood: 32095
- $--2 bd2 ba1.2k sqft310 Via Castillo St #203, Saint Augustine, FL 32095Off Market
- $220,8003 bd2 ba1.3k sqft310 Via Castilla St #201, Saint Augustine, FL 32095Off Market

- $223,3003 bd2 ba1.3k sqft310 Via Castilla St UNIT 101, Saint Augustine, FL 32095Off Market

- $194,600-- bd-- ba1.2k sqft310 Via Castilla St UNIT 102, Saint Augustine, FL 32095Off Market
Similar homes
- $209,0002 bd2 ba1.2k sqft450 LA TRAVESIA FLORA #203, St. Augustine, FL 32095For Sale
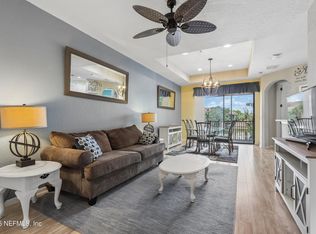 MLS ID #2160138, SAVANNAH CARRICO. realMLS
- $299,9903 bd2 ba1.7k sqft200 PASEO TERRAZA #206, St. Augustine, FL 32095For Sale
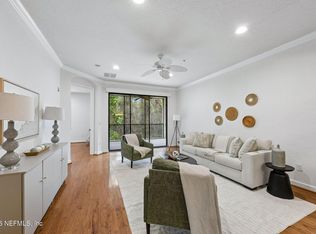 MLS ID #2162792, LINDA PEPPE. realMLS
- $215,0002 bd2 ba1.2k sqft1080 Bella Vista Blvd #13306, Saint Augustine, FL 32084For Sale
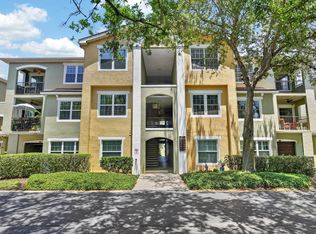 MLS ID #262589, Shelby Hodges, Keller Williams Realty Atlantic Partners St Augustine. St Augustine St Johns County BOR
- $189,9002 bd2 ba1.1k sqft135 LEGENDARY Drive #209, St. Augustine, FL 32092For Sale
 MLS ID #2156921, MARY MCCOLLUM. realMLS
