This Colonial Style Home Features 4 Bedrooms, 2 Full Baths, Eat In Kitchen & 1 Car Garage. The information provided is estimated to the best of our abilities at this time.
Active
$875,900
313 Stephens Ave, Bronx, NY 10473
4beds
2,786sqft
Multi Family
Built in 1920
-- sqft lot
$871,600 Zestimate®
$314/sqft
$-- HOA
What's special
Eat in kitchen
- 28 days
- 262
- 13
Zillow last checked:
Listing updated:
Listed by:
Island Advantage Realty 631-351-6000,
Todd Yovino
Source: StreetEasy,MLS#: S1853843
Facts & features
Interior
Bedrooms & bathrooms
- Bedrooms: 4
- Bathrooms: 2
- Full bathrooms: 2
Features
- Has fireplace: No
Interior area
- Total structure area: 2,786
- Total interior livable area: 2,786 sqft
Property
Parking
- Parking features: Garage
- Has garage: Yes
Details
- Parcel number: 034760058
- Special conditions: In Foreclosure
Construction
Type & style
- Home type: MultiFamily
- Property subtype: Multi Family
Condition
- Year built: 1920
Community & HOA
Community
- Subdivision: Soundview
Location
- Region: Bronx
Financial & listing details
- Price per square foot: $314/sqft
- Tax assessed value: $585,000
- Annual tax amount: $5,928
- Date on market: 10/19/2026
Estimated market value
$871,600
$828,000 - $915,000
$2,306/mo
Price history
| Date | Event | Price |
|---|---|---|
| 9/30/2026 | Sold | $519,268-21.2%$186/sqft |
Source: Public Record Report a problem | ||
| 3/18/2024 | Listing removed | -- |
Source:  OneKey® MLS as distributed by MLS GRID #H6279743 Report a problem | ||
| 2/9/2024 | Pending sale | $659,000$237/sqft |
Source: OneKey® MLS as distributed by MLS GRID #H6279743 Report a problem | ||
| 11/29/2023 | Listed for sale | $659,000+64.8%$237/sqft |
Source: OneKey® MLS as distributed by MLS GRID #H6279743 Report a problem | ||
| 4/14/2008 | Sold | $400,000+58.7%$144/sqft |
Source: Public Record Report a problem | ||
| 9/29/2003 | Sold | $252,000$90/sqft |
Source: Public Record Report a problem | ||
Public tax history
| Year | Property taxes | Tax assessment |
|---|---|---|
| 2025 | $5,670 +5.9% | $35,100 -9.4% |
| 2024 | $5,354 +0.6% | $38,760 +0.5% |
| 2023 | $5,324 | $38,580 +6.5% |
| 2022 | -- | $36,240 +7.9% |
| 2021 | -- | $33,600 +10.7% |
| 2020 | $4,980 +5.9% | $30,360 +1% |
| 2019 | $4,702 +2.9% | $30,060 +37.6% |
| 2018 | $4,570 +2.6% | $21,846 |
| 2017 | $4,453 +7.2% | $21,846 +5.1% |
| 2016 | $4,154 | $20,780 +6% |
| 2015 | $4,154 +67.1% | $19,606 +5.9% |
| 2014 | $2,486 | $18,511 +1.7% |
| 2013 | -- | $18,205 |
| 2012 | -- | $18,205 +5.1% |
| 2011 | -- | $17,317 +6% |
| 2010 | -- | $16,339 +5.9% |
| 2009 | -- | $15,426 +1.7% |
| 2008 | -- | $15,171 |
| 2007 | -- | $15,171 +5.1% |
| 2006 | -- | $14,431 +6% |
| 2005 | -- | $13,616 +5.9% |
| 2004 | -- | $12,855 +1.7% |
| 2003 | -- | $12,643 |
| 2002 | -- | $12,643 +5.1% |
| 2001 | -- | $12,026 +6% |
| 2000 | -- | $11,347 |
Find assessor info on the county website
Monthly payment
Climate risks
Neighborhood: Soundview
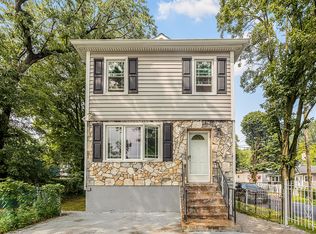
Similar homes
- $--5 bd2 ba2.2k sqft3765 Barnes Ave, Bronx, NY 10467Auction
 Auction.com 1
- $--2 bd2 ba2.2k sqft1008 E 241st St, Bronx, NY 10466Auction
 Auction.com 2
- $935,0006 bd2 ba3.1k sqft236 Meagher Ave, Bronx, NY 10465Active
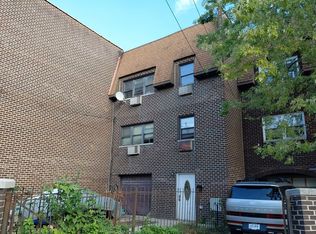 MLS ID #S1855796, Todd Yovino. StreetEasy
- $793,0004 bd2 ba2.1k sqft4318 Edson Ave, Bronx, NY 10466Active
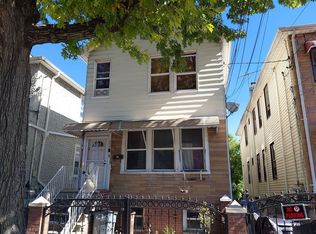 MLS ID #S1854394, Todd Yovino. StreetEasy
- $799,0006 bd4 ba3k sqft3583 Fish Avenue, Bronx, NY 10469For Sale
 MLS ID #1045537, Joseph DeVito ABR, Listing by: Keller Williams Realty Greater. OneKey® MLS as distributed by MLS GRID
- $889,0004 bd3 ba2k sqft94-04 96th Street, Ozone Park, NY 11416For SaleMLS ID #1069058, Devi N. Yee, Listing by: North Star Realty Assoc LLC. OneKey® MLS as distributed by MLS GRID
- $899,9993 bd3 ba1.9k sqft3329 Kingsland Avenue, Bronx, NY 10469For SaleMLS ID #1057560, Maria Porco Rosa, Listing by: Weichert Realtors Legacy Group. OneKey® MLS as distributed by MLS GRID
- $899,0003 bd2 ba1.6k sqft27-43 Humphrey Street, East Elmhurst, NY 11369For SaleMLS ID #1042555, Frederic Sandy, Listing by: Orion Homes Realty LLC. OneKey® MLS as distributed by MLS GRID
