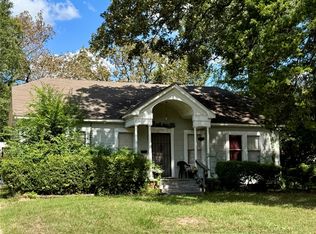
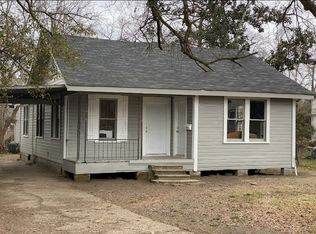
$69,000
3 bd1 ba1k sqft
3202 Wagner St, Shreveport, LA 71108
For Sale
Likely to sell faster than
Zillow last checked:
Listing updated:
Jay Hill 0995712967 318-562-1888,
Mahoney Elite Realty 318-562-1888
Not available
Estimated sales range
Not available
$872/mo
| Date | Event | Price |
|---|---|---|
| 10/28/2026 | Price change | $59,000+18%$56/sqft |
Source: NTREIS #21414469 Report a problem | ||
| 10/17/2026 | Listed for sale | $50,000-9.1%$47/sqft |
Source: NTREIS #21414469 Report a problem | ||
| 7/1/2026 | Listing removed | $55,000$52/sqft |
Source: NTREIS #21313604 Report a problem | ||
| 6/27/2026 | Listed for sale | $55,000+37.5%$52/sqft |
Source: NTREIS #21313604 Report a problem | ||
| 11/23/2024 | Listing removed | $875$1/sqft |
Source: Zillow Rentals Report a problem | ||
| 11/17/2024 | Listed for rent | $875+16.7%$1/sqft |
Source: Zillow Rentals Report a problem | ||
| 1/3/2024 | Sold | -- |
Source: NTREIS #20390878 Report a problem | ||
| 11/14/2023 | Pending sale | $40,000$38/sqft |
Source: NTREIS #20390878 Report a problem | ||
| 9/24/2023 | Listing removed | -- |
Source: NTREIS #20390878 Report a problem | ||
| 9/6/2023 | Price change | $40,000-11.1%$38/sqft |
Source: NTREIS #20390878 Report a problem | ||
| 7/26/2023 | Listed for sale | $45,000$43/sqft |
Source: NTREIS #20390878 Report a problem | ||
| 6/13/2019 | Listing removed | $750$1/sqft |
Source: Caraway Realty & Management, LLC Report a problem | ||
| 4/25/2019 | Listed for rent | $750$1/sqft |
Source: Caraway Realty & Management, LLC Report a problem | ||
| 8/12/2017 | Listing removed | $750$1/sqft |
Source: Caraway Realty & Management, LLC Report a problem | ||
| 6/8/2017 | Listed for rent | $750$1/sqft |
Source: Caraway Realty & Management, LLC Report a problem | ||
| Year | Property taxes | Tax assessment |
|---|---|---|
| 2025 | $448 +0.4% | $2,864 |
| 2024 | $446 -0.8% | $2,864 +1.4% |
| 2023 | $450 | $2,825 |
| 2022 | $450 +1.5% | $2,825 |
| 2021 | $443 0% | $2,825 |
| 2020 | $443 -5.1% | $2,825 -2.2% |
| 2019 | $467 -0.4% | $2,889 |
| 2018 | $469 +26.1% | $2,889 |
| 2017 | $372 +0.2% | $2,889 -9.4% |
| 2015 | $371 -10.9% | $3,190 |
| 2014 | $417 | $3,190 |
| 2013 | $417 | $3,190 |
| 2012 | -- | $3,190 +17.7% |
| 2011 | -- | $2,710 |
| 2010 | -- | $2,710 |
| 2009 | -- | $2,710 |
| 2008 | -- | $2,710 +5% |
| 2007 | -- | $2,580 |
| 2006 | -- | $2,580 |
| 2005 | -- | $2,580 |
| 2004 | -- | $2,580 +27.1% |
| 2003 | -- | $2,030 |
| 2002 | -- | $2,030 |
| 2000 | -- | $2,030 |
Source: NTREIS. This data may not be complete. We recommend contacting the local school district to confirm school assignments for this home.
A local agent can set up tours, give advice and negotiate with sellers.