FHA owned home for sale. Eligible for $100 Down program.
Pre-foreclosure
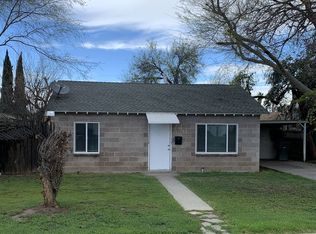
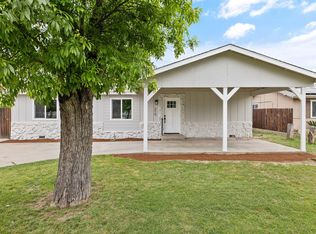
Street View
Est. $316,300
326 Walnut St, Lemoore, CA 93245
3beds
2baths
1,291sqft
SingleFamily
Built in 1950
8,584 Square Feet Lot
$316,300 Zestimate®
$245/sqft
$-- HOA
Overview
- 39 days |
- 21 |
- 0 |
Facts & features
Interior
Bedrooms & bathrooms
- Bedrooms: 3
- Bathrooms: 2
Cooling
- Central
Interior area
- Total interior livable area: 1,291 sqft
Property
Lot
- Size: 8,584 Square Feet
Details
- Parcel number: 020121012000
Construction
Type & style
- Home type: SingleFamily
Materials
- wood frame
Condition
- Year built: 1950
Community & HOA
Location
- Region: Lemoore
Financial & listing details
- Price per square foot: $245/sqft
- Tax assessed value: $127,785
- Annual tax amount: $1,286
Visit our professional directory to find a foreclosure specialist in your area that can help with your home search.
Find a foreclosure agentForeclosure details
Estimated market value
$316,300
$291,000 - $338,000
$1,853/mo
Price history
| Date | Event | Price |
|---|---|---|
| 3/7/2012 | Listing removed | $110,000$85/sqft |
Source: Homes.com #Walnut326 Report a problem | ||
| 3/6/2012 | Listed for sale | $110,000+11.1%$85/sqft |
Source: Homes.com #Walnut326 Report a problem | ||
| 3/3/2010 | Sold | $99,000-51%$77/sqft |
Source: Public Record Report a problem | ||
| 6/3/2009 | Sold | $201,949-8.2%$156/sqft |
Source: Public Record Report a problem | ||
| 8/4/2006 | Sold | $220,000$170/sqft |
Source: Public Record Report a problem | ||
Public tax history
| Year | Property taxes | Tax assessment |
|---|---|---|
| 2025 | $1,286 +5.1% | $127,785 +2% |
| 2024 | $1,224 -1.4% | $125,281 +2% |
| 2023 | $1,242 -3.1% | $122,826 +2% |
| 2022 | $1,281 +2.7% | $120,419 +2% |
| 2021 | $1,248 +0.6% | $118,059 +1% |
| 2020 | $1,240 +0.9% | $116,849 +2% |
| 2019 | $1,229 +6.6% | $114,558 +2% |
| 2018 | $1,153 -0.1% | $112,312 +2% |
| 2017 | $1,154 +6.5% | $110,110 +2% |
| 2016 | $1,084 +0.5% | $107,951 +1.5% |
| 2015 | $1,079 +3.1% | $106,330 +2% |
| 2014 | $1,046 | $104,247 +0.5% |
| 2013 | -- | $103,776 +2% |
| 2012 | $1,021 +2.7% | $101,741 +2% |
| 2011 | $995 -27.1% | $99,746 -23.6% |
| 2010 | $1,365 -39% | $130,500 -41.8% |
| 2008 | $2,237 | $224,400 +2% |
| 2007 | -- | $220,000 +433.1% |
| 2006 | -- | $41,269 +2% |
| 2005 | -- | $40,459 +2% |
| 2004 | -- | $39,665 +1.9% |
| 2003 | -- | $38,938 +2% |
| 2002 | -- | $38,174 +2% |
| 2001 | -- | $37,425 |
Find assessor info on the county website
Monthly payment
Estimated monthly payment$1,822
All calculations are estimates and provided by Zillow, Inc. for informational purposes only. Actual amounts may vary.
HOA fees may include property taxes on listings classified as Co-Ops. Contact the listing agent and/or owner for fee details.
Mortgage interest rates are dependent on a number of factors, including credit score, down payment, and repayment length. Interest rate data provided by Zillow Group Marketplace, Inc. as of 1/1/1970 from various mortgage lenders with which we have lead or other similar arrangements; the Estimated Payment is an average of those rates.
See how much you could borrow to make a competitive offer.
Climate risks
Neighborhood: 93245
Nearby schools
GreatSchools rating
- 4/10Lemoore Elementary SchoolGrades: K-6Distance: 0.6 mi
- 8/10Liberty Middle SchoolGrades: 7-8Distance: 1.2 mi
- 7/10Lemoore High SchoolGrades: 9-12Distance: 0.2 mi

- California
- Kings County
- Lemoore
- 93245
- 326 Walnut St
Nearby cities
Nearby zip codes
Other Lemoore Topics
