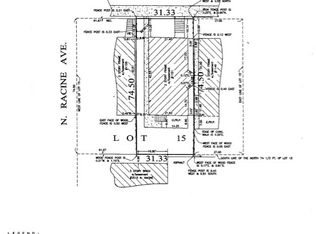
Seller says bring all offers! RM5 zoning in place on TOD site (1 blk to CTA Redline stop). No asking price as sellers would like the market to determine value. Lot has tear down structures (front & rear frame bldgs). Lot size is 25 x 130 (3250SF). FAR = 2.0 so can build 6500SF + basement as of right. On the new Belmont Flyer section of Red line so ALL NEW concrete tracks which are significantly quieter. They also moved the tracks to the opposite side of alley. AS-IS sale only. Reach out to LA for more info.
Contingent
$1,100,000
3311 N Sheffield Ave, Chicago, IL 60657
--beds
--baths
3,250Square Feet
Unimproved Land
Built in ----
3,250 Square Feet Lot
$-- Zestimate®
$--/sqft
$-- HOA
What's special
- 41 days
- 16
- 0
Zillow last checked:
Listing updated:
Listed by:
Michael Hulett (312)867-2261,
Jameson Sotheby's Intl Realty
Source: MRED as distributed by MLS GRID,MLS#: 12773845
Facts & features
Property
Features
- Frontage length: 25
Lot
- Size: 3,250 Square Feet
- Dimensions: 25 x130
Details
- Parcel number: 14204180210000
- Zoning: MULTI
- Special conditions: None
Utilities & green energy
- Utilities for property: Electric to Site, Natural Gas Available
Community & HOA
Location
- Region: Chicago
Financial & listing details
- Tax assessed value: $1,509,140
- Annual tax amount: $31,857
- Date on market: 10/8/2026
- Ownership: Fee Simple
- Electric utility on property: Yes
- Road surface type: Asphalt
Estimated market value
Not available
Estimated sales range
Not available
Not available
Price history
| Date | Event | Price |
|---|---|---|
| 10/8/2026 | Contingent | $1,100,000 |
Source:  MRED as distributed by MLS GRID #12773845 Report a problem | ||
| 10/8/2026 | Listed for sale | $1,100,000 |
Source: MRED as distributed by MLS GRID #12773845 Report a problem | ||
Public tax history
| Year | Property taxes | Tax assessment |
|---|---|---|
| 2024 | $31,465 +59.6% | $150,914 +67.2% |
| 2023 | $19,721 +2.6% | $90,243 |
| 2022 | $19,221 +2.1% | $90,243 |
| 2021 | $18,824 +51.5% | $90,243 +67.6% |
| 2020 | $12,427 -0.2% | $53,835 -10% |
| 2019 | $12,454 -10% | $59,817 -11.5% |
| 2018 | $13,845 -17.9% | $67,599 -10.7% |
| 2017 | $16,855 +7.6% | $75,704 |
| 2016 | $15,666 +9.3% | $75,704 |
| 2015 | $14,329 +18.2% | $75,704 +20% |
| 2014 | $12,119 +1.9% | $63,112 |
| 2013 | $11,898 +1.2% | $63,112 |
| 2012 | $11,752 -20.1% | $63,112 -27.7% |
| 2011 | $14,700 -4.2% | $87,290 -8.5% |
| 2009 | $15,347 +21.8% | $95,386 +12.1% |
| 2008 | $12,602 +1% | $85,091 |
| 2007 | $12,482 -0.5% | $85,091 |
| 2006 | $12,550 +19.6% | $85,091 +36.4% |
| 2005 | $10,497 -15.2% | $62,362 -16.1% |
| 2004 | $12,379 -1.8% | $74,353 -6.7% |
| 2003 | $12,610 +65.3% | $79,687 +87.7% |
| 2002 | $7,629 +3.8% | $42,463 |
| 2001 | $7,353 +65.7% | $42,463 |
| 2000 | $4,439 | $42,463 |
Find assessor info on the county website
Monthly payment
Climate risks
Neighborhood: Lake View
Nearby schools


Similar homes
- $849,0002,334 sqft1151 W Lill Ave, Chicago, IL 60614Active
 MLS ID #12789728, Michael Hulett, Jameson Sotheby's Intl Realty. MRED as distributed by MLS GRID
- $1,197,7704,323 sqft1313 W Ancona St, Chicago, IL 60642Active
 MLS ID #12806362, Malwina Smosna, Chicagoland Brokers, Inc.. MRED as distributed by MLS GRID
- $650,0002,400 sqft1716 N Clybourn Ave, Chicago, IL 60614Active
 MLS ID #12545455, Janis Northon, @properties Christie's International Real Estate. MRED as distributed by MLS GRID
- $550,0002,750 sqft2722 N Western Ave, Chicago, IL 60647ActiveMLS ID #12605553, Vartan Artin, Century 21 Universal. MRED as distributed by MLS GRID
