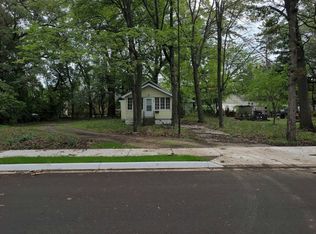
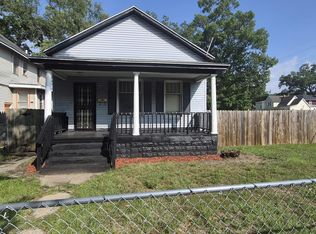
Remodeled 3-bedroom, 1-bathroom home! Whether you're looking for a personal residence or an investment property this house is ready for you, or renters to move right in! Upgrades include new vinyl flooring & trim throughtout, new replacement windows, new interior doors, new furnace (2021) new kitchen cabinets, countertops and appliances. The fully remodeled bathroom includes a shower/tub combo. All appliances remain including washer and dryer. Close proximity to Seaway Drive and Meijer! Set up your private showing today. Seller is a licensed realtor in the State of Michigan.
Pending
$65,000
3319 Waalkes St, Muskegon Heights, MI 49444
3beds
864sqft
Single Family Residence
Built in 1927
5,227 Square Feet Lot
$-- Zestimate®
$75/sqft
$-- HOA
What's special
New replacement windowsNew interior doors
- 27 days
- 387
- 45
Zillow last checked:
Listing updated:
Listed by:
Jaclyn Gettings 616-638-3052,
Five Star Real Estate GH 616-414-9192
Source: MichRIC,MLS#: 26050603
Facts & features
Interior
Bedrooms & bathrooms
- Bedrooms: 3
- Bathrooms: 1
- Full bathrooms: 1
- Main level bedrooms: 3
Heating
- Forced Air
Appliances
- Laundry: In Basement
Features
- Windows: Replacement
- Basement: Partial
- Has fireplace: No
Interior area
- Total structure area: 864
- Total interior livable area: 864 sqft
- Finished area below ground: 0
Video & virtual tour
Property
Features
- Stories: 1
Lot
- Size: 5,227 Square Feet
- Dimensions: 41 x 124
Details
- Parcel number: 26835000006800
Construction
Type & style
- Home type: SingleFamily
- Architectural style: Traditional
- Property subtype: Single Family Residence
Materials
- Vinyl Siding
- Roof: Composition
Condition
- New construction: No
- Year built: 1927
Utilities & green energy
- Sewer: Public Sewer
- Water: Public
Community & HOA
Location
- Region: Muskegon Heights
Financial & listing details
- Price per square foot: $75/sqft
- Tax assessed value: $17,859
- Annual tax amount: $1,207
- Date on market: 9/23/2026
- Listing terms: Cash,Conventional
Estimated market value
Not available
Estimated sales range
Not available
$1,303/mo
Price history
| Date | Event | Price |
|---|---|---|
| 9/28/2026 | Pending sale | $65,000$75/sqft |
Source:  MichRIC #26050603 Report a problem | ||
| 9/23/2026 | Listed for sale | $65,000-13.3%$75/sqft |
Source: MichRIC #26050603 Report a problem | ||
| 5/28/2025 | Listing removed | $1,100$1/sqft |
Source: Zillow Rentals Report a problem | ||
| 3/24/2025 | Listed for rent | $1,100$1/sqft |
Source: Zillow Rentals Report a problem | ||
| 3/23/2025 | Listing removed | $75,000$87/sqft |
Source: MichRIC #25000598 Report a problem | ||
| 1/6/2025 | Listed for sale | $75,000-11.8%$87/sqft |
Source: MichRIC #25000598 Report a problem | ||
| 10/13/2024 | Listing removed | $85,000$98/sqft |
Source: MichRIC #24053720 Report a problem | ||
| 10/11/2024 | Listed for sale | $85,000+136.1%$98/sqft |
Source: MichRIC #24053720 Report a problem | ||
| 10/7/2020 | Sold | $36,000-9.8%$42/sqft |
Source: MichRIC #20034832 Report a problem | ||
| 8/26/2020 | Pending sale | $39,900$46/sqft |
Source: Five Star Real Estate #20034832 Report a problem | ||
| 8/25/2020 | Listed for sale | $39,900+19.1%$46/sqft |
Source: Five Star Real Estate #20034832 Report a problem | ||
| 3/17/2020 | Listing removed | $33,500$39/sqft |
Source: RE/MAX West #19032982 Report a problem | ||
| 12/16/2019 | Price change | $33,500-9.2%$39/sqft |
Source: RE/MAX West #19032982 Report a problem | ||
| 10/2/2019 | Price change | $36,900-7.5%$43/sqft |
Source: RE/MAX West #19032982 Report a problem | ||
| 9/5/2019 | Price change | $39,900-11.1%$46/sqft |
Source: RE/MAX West #19032982 Report a problem | ||
| 8/19/2019 | Price change | $44,900-10%$52/sqft |
Source: RE/MAX West #19032982 Report a problem | ||
| 7/15/2019 | Listed for sale | $49,900$58/sqft |
Source: RE/MAX West #19032982 Report a problem | ||
Public tax history
| Year | Property taxes | Tax assessment |
|---|---|---|
| 2025 | $1,042 -13.7% | $24,500 +21.3% |
| 2024 | $1,207 +4.9% | $20,200 +23.9% |
| 2023 | $1,151 | $16,300 +6.5% |
| 2022 | -- | $15,300 +33% |
| 2021 | $567 | $11,500 +22.3% |
| 2020 | $567 +49.8% | $9,400 +571.4% |
| 2018 | $378 | $1,400 -80% |
| 2017 | -- | $7,000 -4.1% |
| 2016 | -- | $7,300 -3.9% |
| 2015 | -- | $7,600 -30.3% |
| 2014 | -- | $10,900 +2.8% |
| 2013 | -- | $10,600 -10.2% |
| 2012 | -- | $11,800 -6.3% |
| 2011 | -- | $12,600 |
| 2010 | -- | $12,600 -10.6% |
| 2009 | -- | $14,100 -2.1% |
| 2008 | -- | $14,400 +5.1% |
| 2007 | -- | $13,700 |
| 2006 | -- | $13,700 +1.5% |
| 2005 | -- | $13,500 +11.6% |
| 2004 | -- | $12,100 +7.1% |
| 2003 | -- | $11,300 |
| 2002 | -- | $11,300 +3.7% |
| 2001 | -- | $10,900 +0.9% |
| 2000 | -- | $10,800 |
Find assessor info on the county website
Monthly payment
Est. payment
Payment breakdown
Explore the cost of this home by adjusting the details. Changes won't be saved.Climate risks
Neighborhood: 49444

Similar homes
- $64,9002 bd1 ba888 sqft2744 8th St, Muskegon Heights, MI 49444For Sale

 MLS ID #26034320, Reggie E Balcom, RE/MAX West. MichRIC
- $--1 bd1 ba616 sqft3316 Sanford St, Muskegon Heights, MI 49444Auction
 Auction.com 2
- $59,9003 bd1 ba1k sqft2340 Sanford St, Muskegon Heights, MI 49444For Sale
 MLS ID #26048282, David B Crawford, Bellabay Realty LLC. MichRIC
- $75,0002 bd1 ba676 sqft2937 8th St, Muskegon Heights, MI 49444For Sale
 MLS ID #26027571, Tammy Schuiling, Greenridge Realty (Summit). MichRIC
- $79,9002 bd1 ba860 sqft358 E Columbia Ave, Muskegon Heights, MI 49444For SaleMLS ID #26054300, Bruce R Lindstrom, Bellabay Realty LLC. MichRIC
- $85,0003 bd1 ba1.2k sqft459 E Columbia Ave, Muskegon Heights, MI 49444For SaleMLS ID #26053215, McKenna Johnson, RE/MAX West. MichRIC
- $89,9002 bd1 ba888 sqft3036 7th St, Muskegon Heights, MI 49444For SaleMLS ID #26046669, Anthony Nanna, Greenridge - Nexes. MichRIC
- $82,0002 bd1 ba1k sqft2401 Baker St, Muskegon Heights, MI 49444For SaleMLS ID #26046451, Terri Kitchen, TLK Real Estate Inc.. MichRIC
- $89,9002 bd1 ba972 sqft2333 Leahy St, Muskegon Heights, MI 49444For SaleMLS ID #26041072, Kendra Marshall, Westshore Realty Group. MichRIC
- $77,9002 bd1 ba616 sqft2820 Park St, Muskegon Heights, MI 49444For SaleMLS ID #26013472, Nicholas Sparks, Real Estate West. MichRIC
- $74,9002 bd1 ba924 sqft2304 Howden St, Muskegon Heights, MI 49444For SaleMLS ID #26014689, Nicholas Sparks, Real Estate West. MichRIC
- $84,9002 bd1 ba710 sqft2044 Wood St, Muskegon Heights, MI 49444For SaleMLS ID #26050188, Alexis Clark, Keller Williams GR East. MichRIC
- $87,5002 bd1 ba816 sqft3012 9th St, Muskegon Heights, MI 49444For SaleMLS ID #26028951, Holly Anderson, Keller Williams Realty Rivertown. MichRIC
- $54,5003 bd1 ba976 sqft897 Turner Ave, Muskegon, MI 49442For SaleMLS ID #26048978, Charles Campbell, ListWithFreedom.com. MichRIC
- $50,0003 bd1 ba952 sqft697 W Grand Ave, Muskegon, MI 49441For SaleMLS ID #26048966, Charles Campbell, ListWithFreedom.com. MichRIC
- $49,9003 bd1 ba904 sqft1650 Beidler St, Muskegon, MI 49441For SaleMLS ID #26052510, Terry Puffer, Legacy Real Estate Partners. MichRIC
- $97,5002 bd1 ba1k sqft1616 S Getty St, Muskegon, MI 49442For SaleMLS ID #26021328, David Gassman, Apple Realty West. MichRIC
