4 UNITS IN PRIME DOWNTOWN LOCATION CONSISTING OF ALL 2 BEDROOM/ 1 BATHROOM UNITS. NEW ROOF PUT ON IN ~2022. SEPARATELY METERED FOR GAS AND ELECTRIC. 2 GARAGES IN FULLY GATED SECURED BACK OF BUILDING. BLOCKS TO THE BEACH, RESTAURANTS AND DOWNTOWN SHOPPING.
For sale
Listed by: The Moore Group • Kristina Moore • 7148097608
$1,355,000
333 W 9th St, Long Beach, CA 90813
8beds
4baths
3,488sqft
Multi Family
Built in 1913
-- sqft lot
$1,346,300 Zestimate®
$388/sqft
$-- HOA
What's special
- 38 days
- 84
- 4
Zillow last checked:
Listing updated:
Listed by:
Kristina Moore DRE #01926377 7148097608,
The Moore Group
Source: CRMLS,MLS#: PW26205276 Originating MLS: California Regional MLS
Facts & features
Interior
Bedrooms & bathrooms
- Bedrooms: 8
- Bathrooms: 4
Heating
- Wall Furnace
Cooling
- None
Appliances
- Laundry: Inside
Features
- Has fireplace: No
- Fireplace features: None
- Common walls with other units/homes: 2+ Common Walls
Interior area
- Total structure area: 3,488
- Total interior livable area: 3,488 sqft
Property
Parking
- Total spaces: 2
- Parking features: Garage
- Garage spaces: 2
Features
- Levels: Two
- Stories: 2
- Entry location: 2
- Pool features: None
Lot
- Size: 5,015 Square Feet
- Features: 2-5 Units/Acre
Details
- Parcel number: 7272011014
- Special conditions: Standard
Construction
Type & style
- Home type: MultiFamily
- Property subtype: Multi Family
- Attached to another structure: Yes
Condition
- New construction: No
- Year built: 1913
Utilities & green energy
- Sewer: Public Sewer
- Water: Public
Community & HOA
Community
- Features: Suburban
- Subdivision: Downtown (Dt)
Location
- Region: Long Beach
Financial & listing details
- Price per square foot: $388/sqft
- Tax assessed value: $1,639,882
- Date on market: 9/25/2026
- Listing terms: Cash to New Loan
- Inclusions: javascript:__doPostBack('m_lbSubmit', '')
- Total actual rent: 7200
- Tenant pays: Electricity, Gas, Sewer, Trash Collection
Estimated market value
$1,346,300
$1.28M - $1.41M
$2,154/mo
Price history
| Date | Event | Price |
|---|---|---|
| 9/25/2026 | Listed for sale | $1,355,000-10.6%$388/sqft |
Source:  CRMLS #PW26205276 Report a problem | ||
| 3/15/2024 | Listing removed | -- |
Source: Zillow Rentals Report a problem | ||
| 3/1/2024 | Price change | $2,250-8.2%$1/sqft |
Source: Zillow Rentals Report a problem | ||
| 2/23/2024 | Listed for rent | $2,450$1/sqft |
Source: Zillow Rentals Report a problem | ||
| 6/1/2022 | Sold | $1,515,000-0.7%$434/sqft |
Source: Public Record Report a problem | ||
| 4/19/2022 | Pending sale | $1,525,000$437/sqft |
Source: CRMLS #OC22040476 Report a problem | ||
| 3/17/2022 | Contingent | $1,525,000$437/sqft |
Source: CRMLS #OC22040476 Report a problem | ||
| 3/1/2022 | Listed for sale | $1,525,000+263.1%$437/sqft |
Source: CRMLS #OC22040476 Report a problem | ||
| 11/7/2003 | Sold | $420,000$120/sqft |
Source: Public Record Report a problem | ||
Public tax history
| Year | Property taxes | Tax assessment |
|---|---|---|
| 2026 | -- | $1,639,882 +2% |
| 2025 | $21,345 +4.5% | $1,607,729 +2% |
| 2024 | $20,426 +1.7% | $1,576,206 +2% |
| 2023 | $20,084 +167% | $1,545,300 +174.6% |
| 2022 | $7,521 +2.3% | $562,690 +2% |
| 2021 | $7,353 +0.3% | $551,658 +1% |
| 2020 | $7,333 | $546,002 +2% |
| 2019 | $7,333 +4.6% | $535,297 +2% |
| 2018 | $7,013 | $524,802 +2% |
| 2017 | $7,013 +1.1% | $514,513 +2% |
| 2016 | $6,939 +7.7% | $504,426 +1.5% |
| 2015 | $6,443 +4.5% | $496,850 +2% |
| 2014 | $6,166 | $487,119 +2.5% |
| 2012 | -- | $475,412 +2% |
| 2011 | -- | $466,091 +0.8% |
| 2010 | -- | $462,609 -0.2% |
| 2009 | -- | $463,709 +2% |
| 2008 | -- | $454,618 +2% |
| 2007 | -- | $445,705 +2% |
| 2006 | -- | $436,967 |
| 2005 | -- | $436,967 +4% |
| 2004 | -- | $420,000 +774.2% |
| 2003 | -- | $48,044 +2% |
| 2002 | -- | $47,103 +4% |
| 2000 | -- | $45,275 |
Find assessor info on the county website
Monthly payment
Est. payment
Payment breakdown
Explore the cost of this home by adjusting the details. Changes won't be saved.Climate risks
Neighborhood: Willmore City


Similar homes
- $1,299,0007 bd6 ba4.5k sqft310 W 14th St, Long Beach, CA 90813For Sale
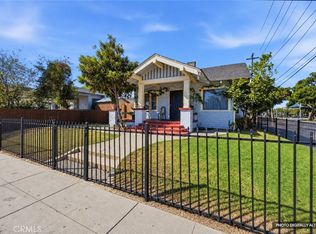 MLS ID #PW26223046, Christian Walsh, Berkshire Hathaway HomeServices California Properties. CRMLS
- $1,299,90010 bd4 ba3.2k sqft117 W 9th St, Long Beach, CA 90813For Sale
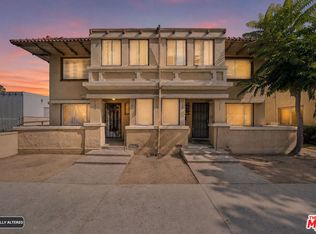 MLS ID #26870367, Kory Jackson DRE # 01315324, eXp Realty of California Inc. CLAW
- $1,290,0008 bd7 ba3.5k sqft1125 Linden Ave, Long Beach, CA 90813For Sale
 MLS ID #PW26122847, Augustin Joo, California Bridge Realty. CRMLS
- $1,199,0008 bd4 ba3k sqft1273 Chestnut Ave, Long Beach, CA 90813For Sale
 MLS ID #SB26124554, Joshua Hammond, Compass. CRMLS
